Pandas Mean
The pandas.DataFrame.mean() calculates the average of values over the specified axis (rows/columns) of the Pandas DataFrame. It can be possible to exclude the missing values while calculating the mean using this function.
Syntax:
Let’s see the syntax of the mean() function for the Pandas DataFrame:
- axis: By default, it returns the mean across the columns (axis = 0 / axis= “columns”). To return the mean across each row, set the axis to 1 (axis = 1 / axis= “index”).
- skipna: (by default = True) The mean is NaN if this parameter is set to “False”.
The pandas.Series.mean() calculates the average of values that are present in the Pandas Series. It can be possible to exclude the missing values while calculating the mean using this function that is similar to the Pandas DataFrame.
Syntax:
Let’s see the syntax of the mean() function for the Pandas Series:
- axis: By default, it returns the mean across the columns. This is optional.
- skipna: (by default = True) The mean is NaN if this parameter is set to “False”.
Axis Parameter
In this scenario, we calculate the mean of the Series and DataFrame by specifying the “axis” parameter.
Example 1: Series
We create a Series with five values and return the mean of these five values. Specify the axis parameter to the function by setting it to 0. It can be optional.
# Create Series - day_wise_salary with 5 values
day_wise_salary=pandas.Series([1000,1500,900,1300,2000])
print(day_wise_salary,"\n")
# Get the mean of the above Series
print('Average Salary:',day_wise_salary.mean(axis=0))
Output:
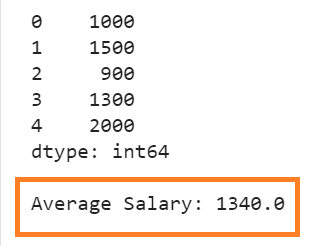
Average => [(1000+1500+900+1300+2000)/5] => 1340.0
Example 2: DataFrame
We create a DataFrame with four columns and six rows. [“Day-1 Count”, “Day-2 Count”, “Day-3 Count”, “Day-4 Count”] are the columns and [“Camp-1”, “Camp-2”, “Camp-3”, “Camp-4”, “Camp-5”, “Camp-6”] are the row index labels.
- Calculate the mean across the rows by specifying axis =1.
- Calculate the mean across the columns by specifying axis =0.
# Create DataFrame - daily_camps with 4 columns and 6 records
daily_camps = pandas.DataFrame([[1000,250,600,900],
[300,500,100,0],
[0,500,100,1700],
[400,300,600,900],
[800,250,200,1000],
[700,270,680,1200],
],
columns=['Day-1 Count', 'Day-2 Count', 'Day-3 Count', 'Day-4 Count'],
index=['Camp-1', 'Camp-2', 'Camp-3', 'Camp-4','Camp-5', 'Camp-6'])
print(daily_camps,"\n")
# Get the Mean across rows
print(daily_camps.mean(axis=1),"\n")
# Get the Mean across columns
print(daily_camps.mean(axis=0))
Output:
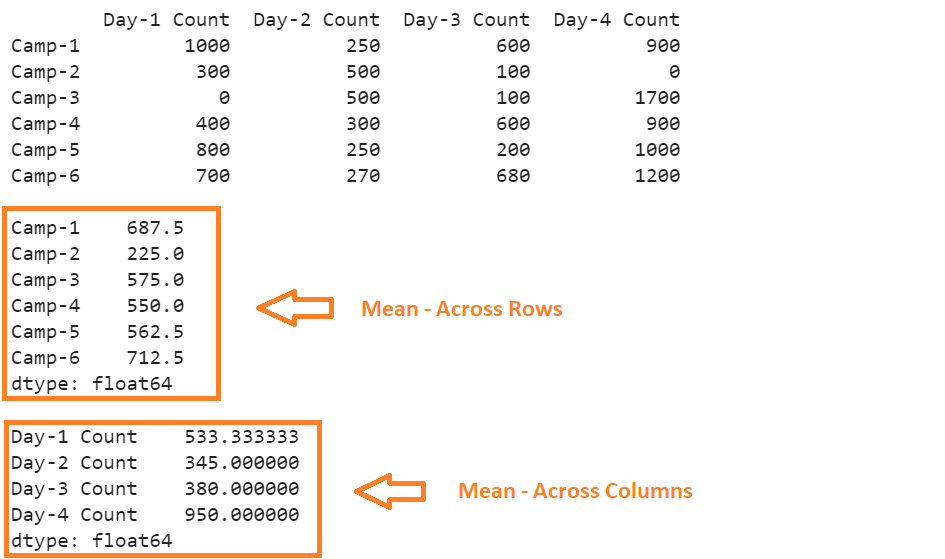
- The first output is the actual DataFrame.
- In the second output, the mean is returned across each row. “Camp-1” => (1000+250+600+900)/4 => 687.5. This is similar for the remaining five rows.
- In the third output, the mean is returned across each column. “Day-1 Count” => (1000+300+0+400+800+700)/6 => 533.333333. This is similar for the remaining five columns.
Skipna Parameter
In this scenario, we calculate the mean of the Series and DataFrame by including and excluding the missing values.
Example 1: Series
We create a Series with five values that include the missing values and return the mean of these five values. First, we set the “skipna” parameter to “True” and then to “False”.
# Create Series - day_wise_salary with 5 values
day_wise_salary=pandas.Series([1000,None,900,None,None])
print(day_wise_salary,"\n")
# skipna=True
print('Average Salary:',day_wise_salary.mean(axis=0,skipna=True),"\n")
# skipna=False
print('Average Salary:',day_wise_salary.mean(axis=0,skipna=False))
Output:
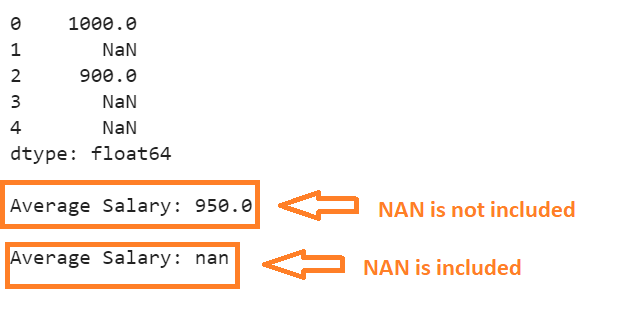
- The missing values (NaN) are not included while calculating the mean. There are three missing values in the previous Series. So, the Average Salary => (1000 + 900)/2 => 950.0
- The missing values (NaN) are considered while calculating the mean. So, the result is nan.
Example 2: DataFrame
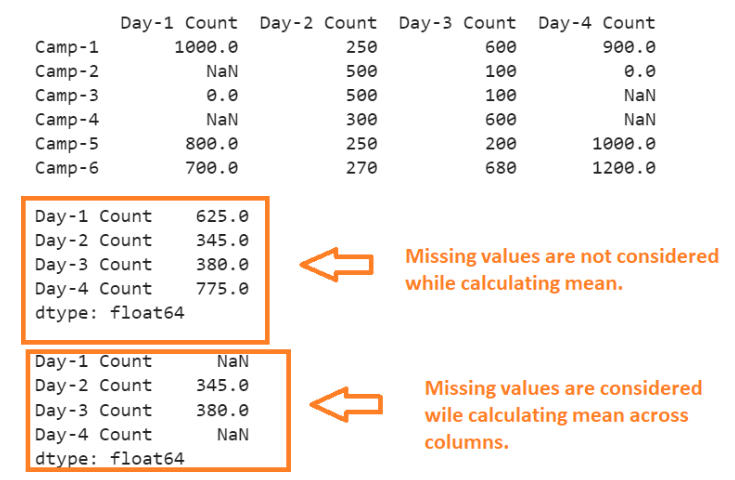
Consider the “daily_camps” DataFrame with the “None” values and calculate the mean across the columns with the “skipna” parameter.
# Create DataFrame - daily_camps with 4 columns and 6 records
daily_camps = pandas.DataFrame([[1000,250,600,900],
[None,500,100,0],
[0,500,100,None],
[None,300,600,None],
[800,250,200,1000],
[700,270,680,1200],
],
columns=['Day-1 Count', 'Day-2 Count', 'Day-3 Count', 'Day-4 Count'],
index=['Camp-1', 'Camp-2', 'Camp-3', 'Camp-4','Camp-5', 'Camp-6'])
print(daily_camps,"\n")
# skipna=True
print(daily_camps.mean( skipna=True),"\n")
# skipna=False
print(daily_camps.mean( skipna=False))
First Output:
Second Output:
- “Day-1 Count”: Two missing values are ignored. The mean of 1000,0,800 and 700 is 625.0.
- “Day-2 Count”: The missing values don’t exist. The mean of all five values is 345.0.
- “Day-3 Count”: The missing values don’t exist. The mean of all five values is 380.0.
- “Day-4 Count”: Two missing values are ignored. The mean of 900,0,1000 and 1200 is 775.0.
Last Output:
- “Day-1 Count”: Two missing values exist. So, the mean is NaN.
- “Day-2 Count”: The missing values don’t exist. The mean of all five values is 345.0.
- “Day-3 Count”: The missing values don’t exist. The mean of all five values is 380.0.
- “Day-4 Count”: Two missing values exist. So, the mean is NaN.
Get the Mean of a Specific column
It is possible to return the mean of the specific column using the pandas.DataFrame.mean() function. We need to pass the column name along inside the square brackets.
Let’s utilize the same DataFrame and return the mean of the “Day-1 Count” and “Day-2 Count” columns separately.
# Create DataFrame - daily_camps with 4 columns and 6 records
daily_camps = pandas.DataFrame([[1000,250,600,900],
[300,500,100,0],
[0,500,100,1700],
[400,300,600,900],
[800,250,200,1000],
[700,270,680,1200],
],
columns=['Day-1 Count', 'Day-2 Count', 'Day-3 Count', 'Day-4 Count'],
index=['Camp-1', 'Camp-2', 'Camp-3', 'Camp-4','Camp-5', 'Camp-6'])
# 'Day-1 Count' - Mean
print(daily_camps['Day-1 Count'].mean())
# 'Day-2 Count' - Mean
print(daily_camps['Day-2 Count'].mean())
Output:
The mean of the “Day-1 Count” column is 533.333 and the “Day-2 Count” column is 345.0.
Conclusion
We learned how to calculate the mean of the Series and DataFrame using the pandas.Series.mean() and pandas.DataFrane.mean() functions. All the parameters are discussed with a separate example for both data structures. For each code snippet, an output is explained clearly with a screenshot.