Python supports several libraries, such as Pandas, Matplotlib, Seaborn, and others, for data manipulation, analysis, and visualization. The Pandas module can perform several operations, including applying specified functions to group data of DataFrame. The “df.groupby()” and “apply()” methods of the “pandas” module are used together to accomplish this task.
This Python write-up presented a detailed guide on how to apply a specified function to the DataFrame group using several examples and via the following contents:
- How to Apply Specified Function Using “apply()” on the Group Data in Python?
- Determining the Maximum Value of the Group Data Using the “apply()” Method
- Determining the Mean Difference of the Group Data Using the “apply()” Method
- Determining the Relative Frequency Value of the Group Data Using the “apply()” Method
- Applying the Custom-Defined Function Using the “apply()” Method
How to Apply Specified Function Using “apply()” on the Group Data in Python?
In Python, the “DataFrame.apply()” method is used along with the “DataFrame.groupby()” method to apply the specified function group-wise to every item/element in a Pandas Series object or to every DataFrame column or row.
Syntax
The general syntax of the DataFrame.apply() method is provided below:
Python supports several libraries, such as Pandas, Matplotlib, Seaborn, and others, for data manipulation, analysis, and visualization. The Pandas module can perform several operations, including applying specified functions to group data of DataFrame. The “df.groupby()” and “apply()” methods of the “pandas” module are utilized together to accomplish this task.
Syntax
Here is the syntax of the DataFrame.groupby() method:
In the above syntax, the “by” parameter is used to signify how to group the data, and the “axis” parameter is used to indicate the axis of the group data. For a detailed understanding, read this article.
Return Value
The “DataFrame.groupBy()” and the “apply()” method retrieve the DataFrame or Series object.
Example 1: Determining the Maximum Value of the Group Data Using the “apply()” Method
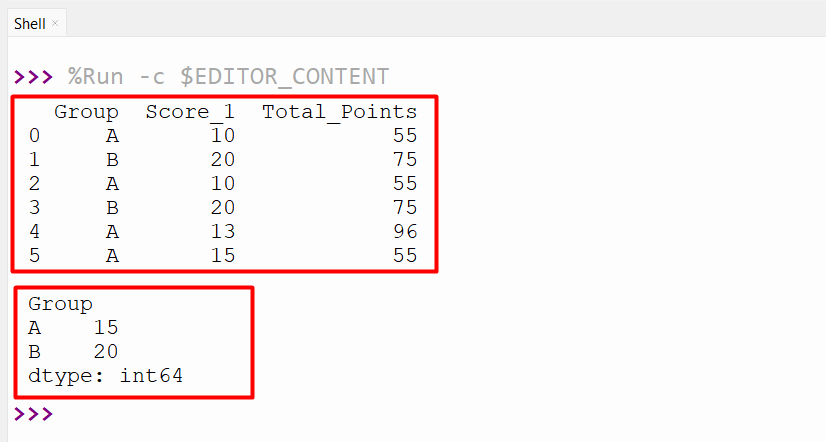
Here, the “pandas” module is imported, and the “pandas.DataFrame()” is created with multiple columns. Next, the “df.groupby()” method is used to group the Data according to the specified column. After that, the “df.apply()” function is used to apply the lambda function to all the rows of the DataFrame to get the maximum value:
df = pandas.DataFrame({'Group': ['A', 'B', 'A', 'B', 'A', 'A'],
'Score_1': [10, 20, 10, 20, 13, 15],
'Total_Points': [55, 75, 55, 75, 96, 55]})
print(df, '\n')
df1 = df.groupby('Group').apply(lambda x: x['Score_1'].max())
print(df1)
The maximum value of the group data has been retrieved successfully:
Example 2: Determining the Mean Difference of the Group Data Using the “apply()” Method
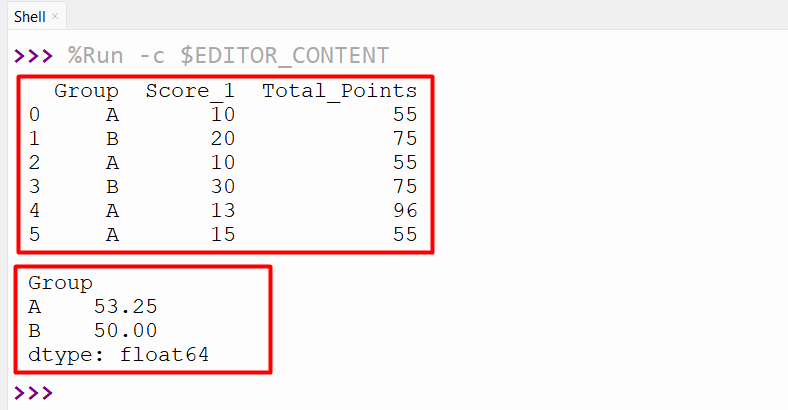
In the following code, the DataFrame has been grouped based on the specified DataFrame column value. After grouping, the “apply()” method is employed to apply the lambda function. Here, the lambda function is used along with the “mean()” function to determine the mean difference of the group data. Take the following//below code as an instance:
df = pandas.DataFrame({'Group': ['A', 'B', 'A', 'B', 'A', 'A'],
'Score_1': [10, 20, 10, 30, 13, 15],
'Total_Points': [55, 75, 55, 75, 96, 55]})
print(df, '\n')
df1 = df.groupby('Group').apply(lambda x: (x['Total_Points'] - x['Score_1']).mean())
print(df1)
This code retrieves the following DataFrame to the output:
Example 3: Determining the Relative Frequency Value of the Group Data Using the “apply()” Method
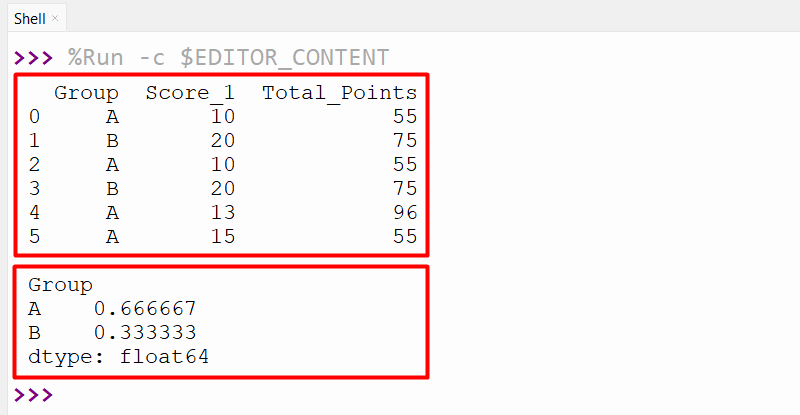
The below code is used to create the DataFrame using the “pandas.DataFrame()”. After creating DataFrame, the “df.groupby()” method is employed to group the Data with respect to the column “Group”. Next, the “apply()” method is used to apply the specified lambda function to get the frequency value of the DataFrame:
df = pandas.DataFrame({'Group': ['A', 'B', 'A', 'B', 'A', 'A'],
'Score_1': [10, 20, 10, 20, 13, 15],
'Total_Points': [55, 75, 55, 75, 96, 55]})
print(df, '\n')
df1 = df.groupby('Group').apply(lambda x: x['Group'].count() / df.shape[0])
print(df1)
The relative frequency value of the specified group data has been determined successfully:
Example 4: Applying the Custom-Defined Function Using the “apply()” Method
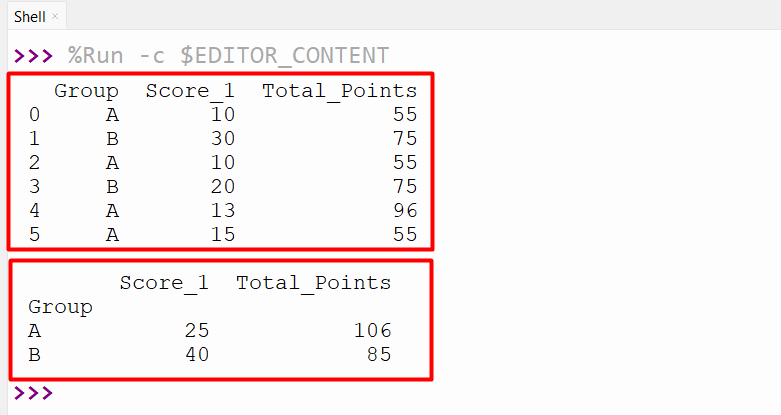
Here, the DataFrame is created, and the “func” is defined with the return value of the addition of the maximum value and passed argument value. The “df.groupby()” method is used to group the data based on the specified column and apply the custom-defined function to the group data:
df = pandas.DataFrame({'Group': ['A', 'B', 'A', 'B', 'A', 'A'],
'Score_1': [10, 30, 10, 20, 13, 15],
'Total_Points': [55, 75, 55, 75, 96, 55]})
print(df,"\n")
def fun(ser, n):
return ser.max()+n
df1 = df.groupby('Group').apply(fun, n=10)
print(df1)
The above code successfully applies the custom-defined function to the DataFrame:
Conclusion
In Python, the “df.apply()” method is utilized along with the “df.groupby()” method to apply the specified function to the DataFrame group data. This method can be used to apply various specified functions, such as the max() function, mean() function or custom function, etc, on the group data. This write-up delivered a comprehensive guide on applying the specified function to group data using multiple examples.