Using Pandas.DataFrame
The pandas.DataFrame() constructs the DataFrame with the given data. It takes the data as the parameter. In our scenario, the data will be Series.
Syntax:
- The data can be Series, arrays, dictionaries, lists etc.
- index – Specify the indices to the DataFrame. Indexing starts from 0 by default.
- We can specify the column labels using the “columns” parameter. They can be passed through a list.
Example 1:
Create a Series with five strings and pass this Series to the pandas.DataFrame().
# Create Series with 5 strings
campaign_series=pandas.Series(['Marketing','Sales','Technical','Other','Finance'])
print(campaign_series,"\n")
print(type(campaign_series),"\n")
# Create DataFrame from the above Series.
campaign_df=pandas.DataFrame(campaign_series)
print(campaign_df,"\n")
print(type(campaign_df))
Output:
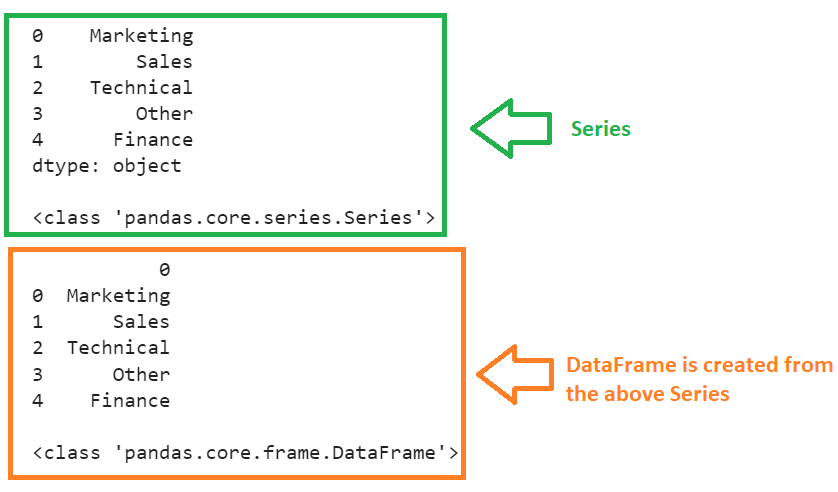
The DataFrame (with one column) is created from the Series (see the type of the data structure in each case) without the column label. But we can have the row indices.
Example 2:
Create the DataFrame from the same Series with the column name as “Campaign Type” (pass the columns parameter).
# Create Series with 5 strings
campaign_series=pandas.Series(['Marketing','Sales','Technical','Other','Finance'])
print(campaign_series,"\n")
print(type(campaign_series),"\n")
# Create DataFrame from the above Series with column label
campaign_df=pandas.DataFrame(campaign_series,columns=['Campaign Type'])
print(campaign_df,"\n")
print(type(campaign_df))
Output:
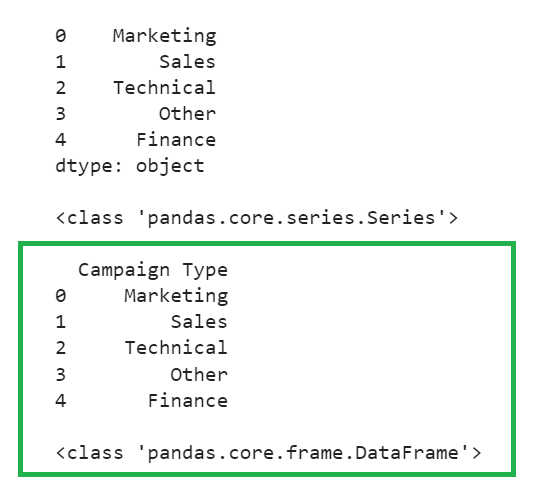
You can see the column label in the DataFrame.
Example 3:
Create the campaign_df DataFrame with the “Camp_Name” and “Status” columns such that the Series are inserted as rows in the DataFrame. These are passed to the DataFrame constructor through the list. Then, we can assign the column labels using the pandas.DataFrame.columns property.
# Create DataFrame with two rows Using Series as Rows
campaign_df=pandas.DataFrame([pandas.Series(['Marketing','Completed']),
pandas.Series(['Sales','In Progress'])])
# Create column labels
campaign_df.columns=['Camp_Name','Status']
print(campaign_df)
Output
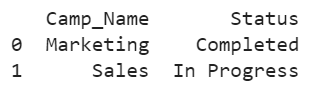
You can see that the DataFrame is created from the Series as rows with specified column names.
Example 4: Add New Column to the Existing DataFrame
Consider the Pandas DataFrame (Campaign_df) with three rows and three columns. Add one column which is “Budget” using the square brackets by passing the data through the Series.
campaign_df=pandas.DataFrame([['Marketing','Conference','Completed'],
['Sales','Email','Completed'],
['Technical','Webinar','Aborted']],columns=['Campaign_Name','Type','Status'])
print(campaign_df,"\n")
# Adding a new column
campaign_df['Budget']=pandas.Series([1000,2000,3000,2500])
print(campaign_df)
Output:
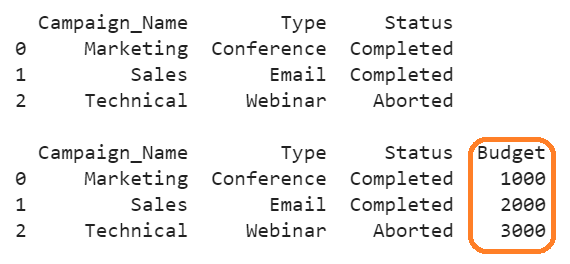
Now, the “Budget” column is added with the values from the Series.
Example 5: Create a DataFrame from Multiple Series
Consider three Series – campaign_series, type_series, and status_series. Construct the DataFrame from these three Series by passing them as dictionary values. The keys are the column names in the resulting DataFrame.
campaign_series=pandas.Series(['Marketing','Sales','Technical','Other','Finance'])
type_series=pandas.Series(['Conference','Public','Email','Webinar','Conference'])
status_series=pandas.Series(['In progress','Completed','Aborted','Started','Aborted'])
# Create DataFrame from the multiple Series
campaign_df=pandas.DataFrame({'Campaign_Name':campaign_series,
'Type':type_series,'Status':status_series})
print(campaign_df)
Output:
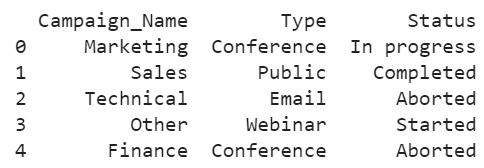
Each Series creates a column in the Pandas DataFrame with a column label. The number of rows in the DataFrame is 5.
Using Pandas.Concat
The pandas.concat() function is used to concatenate two or more DataFrames along the rows or columns. This is controlled using the axis parameter. It is 0 by default.
- If we pass the Series to this function, the DataFrame is created with column. The total number of columns depend upon the total number of Series that we pass to this function.
- We can also pass the existing DataFrame and Series such that the Series is inserted as a new column to this existing DataFrame.
Syntax:
The following is the syntax of the pandas.concat() function to create the DataFrame from the Series.
- other: It refers to another DataFrame in which the rows of this DataFrame are appended to the existing DataFrame. If you want to append a single row, you need to pass a dictionary of values as the parameter. In our case, it is multiple Series.
- If axis = 0, the concatenation is done along the rows. Concatenation is done along the columns if it is set to 1.
Example 1: Add a New Column to the Existing DataFrame
Consider the Pandas DataFrame (Campaign_df) with three rows and three columns. Add one column which is “Budget” by passing the data through the Series. The axis parameter is set to 1 because we concatenate a new column to the existing DataFrame.
campaign_df=pandas.DataFrame([['Marketing','Conference','Completed'],
['Sales','Email','Completed'],
['Technical','Webinar','Aborted']],columns=['Campaign_Name','Type','Status'])
print(campaign_df,"\n")
series=pandas.Series([1000,2000,3000], name="Budget")
# Adding a new column
campaign_df=pandas.concat([campaign_df,series], axis=1)
print(campaign_df)
Output:
Now, the “Budget” column is added with values from the Series.
Example 2: Create a DataFrame from Multiple Series
Consider three Series – campaign_series, type_series, and status_series. Construct the DataFrame from these three Series using the concat() function. Set the axis to 1.
campaign_series=pandas.Series(['Marketing','Sales','Technical','Other','Finance'])
type_series=pandas.Series(['Conference','Public','Email','Webinar','Conference'])
status_series=pandas.Series(['In progress','Completed','Aborted','Started','Aborted'])
# Create DataFrame from the 3 Series using concat()
campaign_df=pandas.concat([campaign_series,type_series,status_series], axis=1)
print(campaign_df)
Output:
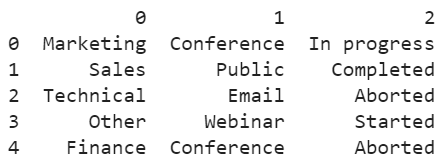
Each Series creates a column in the Pandas DataFrame. The number of rows in the DataFrame is 5.
Conclusion
We now learned how to create a DataFrame from the Series with examples. Also, we created a DataFrame with multiple columns by passing multiple Series as Dictionary of values. The keys are the column names in the resulting DataFrame. We also utilized the concat() function to create the DataFrame by passing multiple Series and adding a new column to the DataFrame from the Series.