In Python, pandas supports the corr() function, which generates a correlation matrix with correlation coefficients included. In this guide, we will discuss how to generate a correlation matrix from the pandas DataFrame using this function and discuss different parameters that are passed to this function with separate examples. For visualization of the correlation matrix, we will demonstrate how to create HeatMap.
The correlation coefficient varies between -1 to +1. Two variables are positively correlated if the correlation coefficient is greater than 0. When the correlation coefficient is equal to 0, there is no correlation between the two variables. Two variables are negatively correlated if the correlation coefficient is less than 0.
pandas.DataFrame.corr() function is used to compute the pairwise correlation of DataFrame columns. It will not consider the missing values that exist in the DataFrame.
Syntax
Let’s see the syntax and the parameters passed to this function.
- There are different correlation methods that exist mathematically. This method parameter will take the correlation method. It can take ‘kendall’, ‘spearman’ and ‘pearson’. By default, it will consider ‘pearson’ as the correlation method.
- The minimum number of observations required per pair of columns to have a valid result is set by the min_periods parameter (default = 1). ‘Kendall’ method is not used along with this parameter.
- The numeric_only (default = False) include numeric data columns like int, float.
Dataset
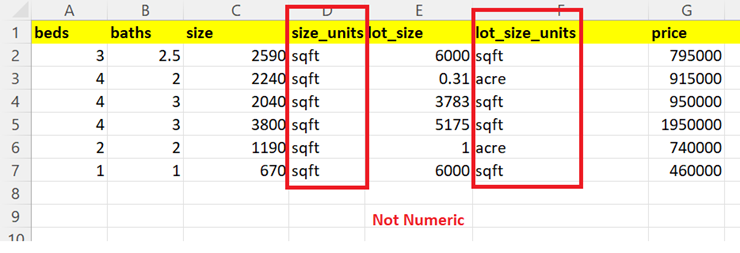
In this entire guide, we will use the houses.csv file that holds seven columns and six records. There are five numeric columns [‘beds’, ‘baths’, ‘size’, ‘lot_size’, ‘price’] and two non-numeric columns [‘size_units’, ‘lot_size_units’]. We won’t consider these two columns while creating the correlation matrix.
Let’s import this into the pandas DataFrame.
# Import houses.csv file into house_df DataFrame.
house_df = pandas.read_csv('houses.csv')
print(house_df)
print(Marks.quantile())
Output
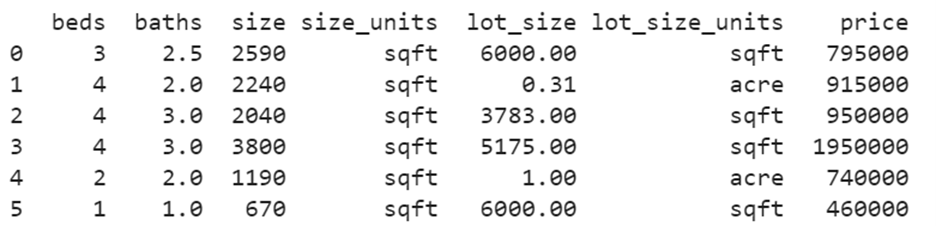
Now this DataFrame holds seven columns with six records.
Example 1: No Parameters
Let’s compute the correlation matrix for the house’s DataFrame with Pearson correlation as the default method.
house_df = pandas.read_csv('houses.csv')
# Correlation matrix for the above DataFrame
print(house_df.corr())
Output
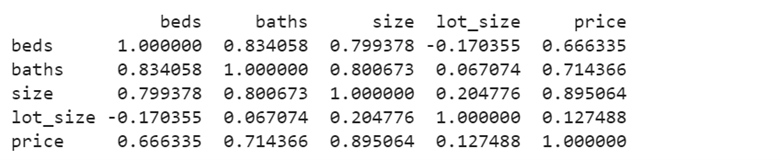
A correlation coefficient matrix is generated for five columns. Diagonal positions in the matrix are positively correlated, as they are equal. Basically, the correlation matrix holds the correlation coefficients. We will say
- The correlation between beds and baths is 0.834058, indicating a strong positive correlation.
- The correlation between beds and size is 0.799378, showing a strong positive correlation.
- There is a negative correlation between beds and lot_size is -0.170355.
- The correlation between beds and price is 0.666335, signifying a moderate positive correlation.
This way, you can compare the correlation for all the columns.
Example 2: Method Parameter
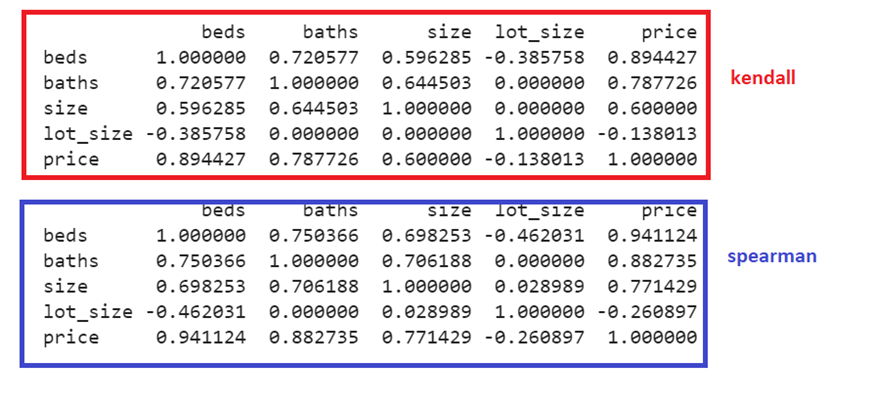
First, we will return the correlation matrix with kendall and then spearman.
house_df = pandas.read_csv('houses.csv')
# Correlation matrix - kendall
print(house_df.corr(method='kendall'),"\n")
# Correlation matrix - spearman
print(house_df.corr(method='spearman'),"\n")
Output
The correlation coefficients are different in both the matrices. The coefficients in the ‘spearman’ methods are greater than the coefficients in the ‘kendall’ method.
Example 3: Filtering Positive Correlation Coefficients
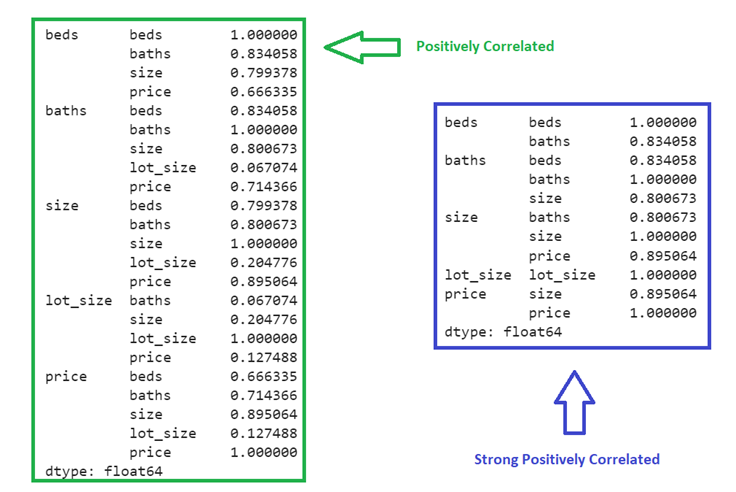
In this example, we will first filter the results that are positively correlated (greater than 0), then we will get the data that are strongly positively correlated (greater than 0.8).
house_df = pandas.read_csv('houses.csv')
# Positive Correlations from the Correlation matrix
corr_matrix= house_df.corr(numeric_only=True,).unstack()
print(corr_matrix[corr_matrix > 0],"\n")
# Strong Positive Correlations from the Correlation matrix
corr_matrix= house_df.corr(numeric_only=True,).unstack()
print(corr_matrix[corr_matrix > 0.8])
Output
Example 4: Filtering Negative Correlation Coefficients
Let’s filter the results that are negatively correlated (less than 0).
house_df = pandas.read_csv('houses.csv')
# Negative Correlations from the Correlation matrix
corr_matrix= house_df.corr(numeric_only=True,).unstack()
print(corr_matrix[corr_matrix < 0],"\n")
Output
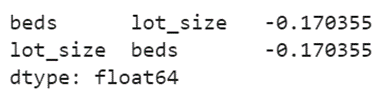
Only beds are negatively correlated with lot_size.
Example 5: Visualizing the Correlation Matrix Using Heatmap
Utilize the Heatmap from the seaborn library and plot it using the pyplot from the matplotlib library.
- Pass the pandas.DataFrame.corr() function to the heatmap.
- Sett the annot parameter to True for displaying the coefficient value in each grid.
- The fmt parameter is used to format the coefficient values to 1 decimal points. We have to set it to display one decimal point.
- The cmap parameter is set to the color map named “crest.”
import seaborn
import matplotlib
house_df = pandas.read_csv('houses.csv')
seaborn.heatmap(house_df.corr(numeric_only=True),fmt=".1f",annot=True,cmap="crest")
matplotlib.pyplot.show()
Output
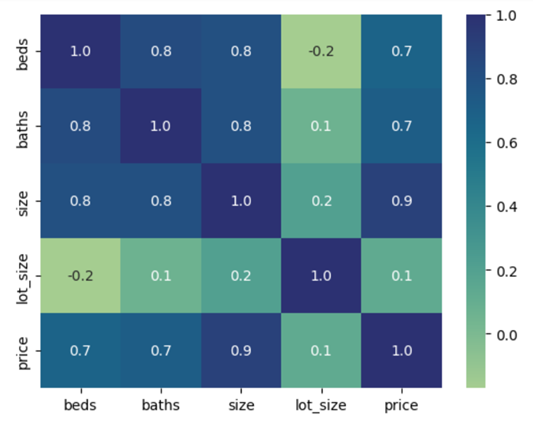
You can see the color scale that represents the correlation coefficients, and also on each grid, you will see the coefficient.
Example 6: Filtering Negative Correlation Coefficients
The NumPy module supports the corrcoef() function, which will return the correlation coefficient (Pearson product-moment) for two variables. It will only take two variables (DataFrame columns).
- Return Pearson product-moment correlation coefficient for ‘beds’ and ‘baths.’
- Return Pearson product-moment correlation coefficient for ‘beds’ and ‘size.’
import pandas
house_df = pandas.read_csv('houses.csv')
# Return Pearson product-moment correlation coefficient
print(numpy.corrcoef(house_df['beds'], house_df['baths']),"\n")
print(numpy.corrcoef(house_df['beds'], house_df['size']),"\n")
Output
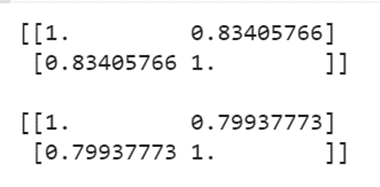
The correlation coefficient for beds and baths is 0.83405766, and for beds and size is 0.79937773.
Conclusion
We saw how to compute the correlation matrix from the pandas DataFrame using the pandas.DataFrame.corr() function. All the parameters that are passed to this parameter are discussed in a separate example. It is possible to visualize the correlation between different variables using the Heatmap. We also discussed how to filter positive and negative correlation coefficients with examples.