The Pandas library has multiple functions for performing operations, such as filtering, sorting, aggregating, etc. on DataFrames or Series objects. While dealing with the Pandas objects, sometimes we need to analyze the distribution of data by grouping them into various ranges. We can bin or divide the given data into equal sizes using the “cut()” and “qcut()” methods of the Pandas module in Python.
This guide explains Pandas bins via multiple examples. The following methods are used to bin the Pandas DataFrame in Python:
Method 1: Bin Data in Pandas Using the “cut()” Method
The “pandas.cut()” method is utilized to segment or sort data values into bins. It is primarily used for converting/transforming a continuous to a categorical variable and executing statistical analysis on scalar data.
Syntax
Parameters
In this syntax:
- The “x” parameter represents a unidimensional array. This is an array that we require to bin.
- The “bins” parameter defines the bin edges for the segmentation/sections.
- The “right” parameter is a boolean value that specifies whether the rightmost edge of the bins is included or not. (Default True)
- The “labels” parameter is an array or boolean value that indicates the labels for the retrieved bins. The length/size of the labels must be the equivalent length of the retrieving bins.
- The “retbins” parameter is a boolean value that determines whether to retrieve the bins.
- The “precision” specifies the decimal precision to use while computing bins.
- The “include_lowest” parameter indicates whether the “1st” interval should be left-inclusive.
- The “duplicates” and “ordered” parameters specify how to handle non-unique bins and whether the labels are ordered.
Return Value
The “pandas.cut()” method retrieves the value based on the input and the parameter used. It can be a Series, a categorical object, or a tuple containing a series or categorical object and the computed bins.
Example 1: Bin Pandas DataFrame Data
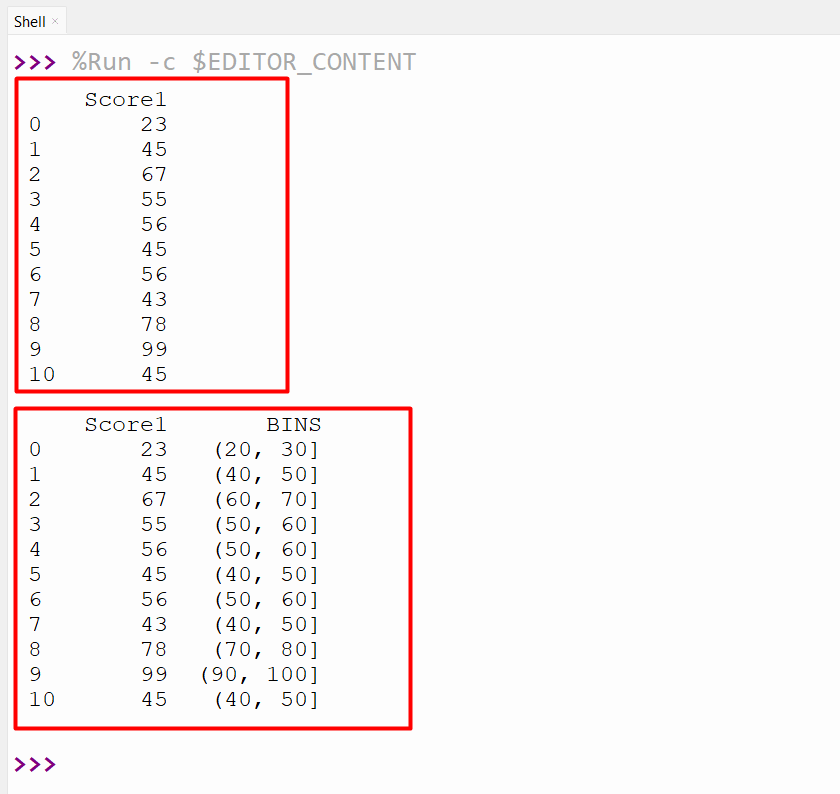
In the below code, we imported “pandas” and created the DataFrame with the default numeric index. Next, we created a new column “BINS” that uses the “pandas.cut()” method to assign the column value to the bin based on the range of values. For instance, if the value is between 1 and 10, then it belongs to a bin[1,10], which specifies that it is greater than 1 and less than or equal to 10:
df=pandas.DataFrame({'Score1':[23,45,67,55,56,45,56,43,78,99,45]})
print(df, '\n')
df['BINS'] = pandas.cut(df['Score1'], bins=[1,10,20,30,40,50,60,70,80,90,100])
print(df,'\n')
In the below snippet, the “BINS” column contains the categorical data that indicates which bin each value belongs to:
Example 2: Bin Pandas DataFrame Data with Labels
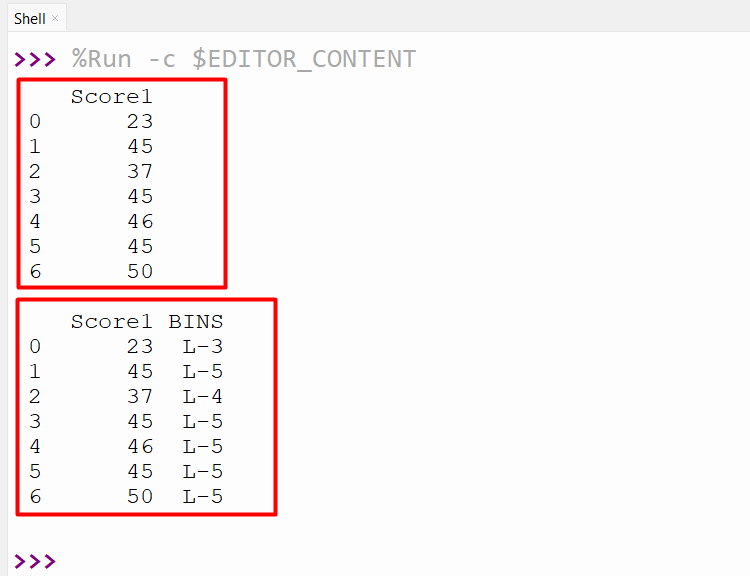
We can also specify the labels for bins created. For specifying labels, the “labels” parameter with list values of the same length as generated bins is passed to the “pandas.cut()” method. Let’s understand it via the following example:
df=pandas.DataFrame({'Score1':[23,45,37,45,46,45,50]})
print(df, '\n')
df['BINS'] = pandas.cut(df['Score1'], bins=[1,10,20,30,40,50], labels=['L-1', 'L-2', 'L-3', 'L-4', 'L-5'])
print(df,'\n')
The following snippet contains the bin labels:
Example 3: Bin Pandas DataFrame Data with Precision
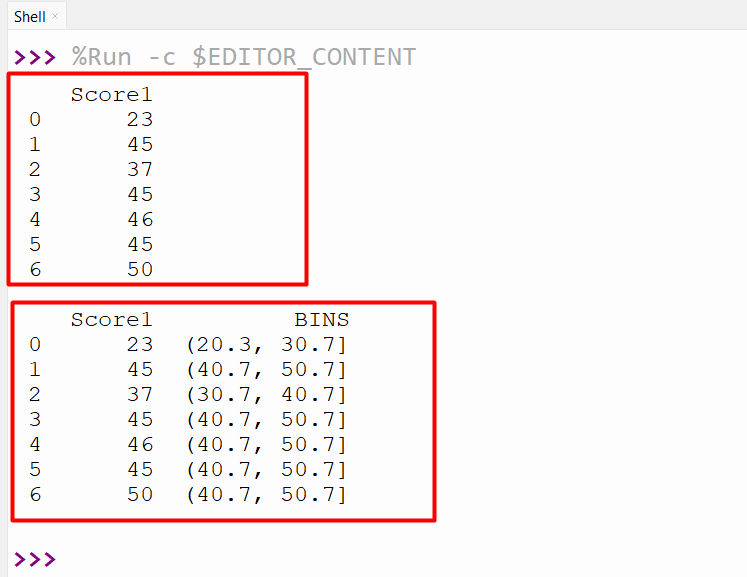
We can also specify the precision which is the number of decimal places of boundary values with the precision parameter.
df=pandas.DataFrame({'Score1':[23,45,37,45,46,45,50]})
print(df, '\n')
df['BINS'] = pandas.cut(df['Score1'], bins=[1,10.333,20.333,30.666,40.666,50.667], precision=1)
print(df,'\n')
The new columns bins have been added to DataFrame:
Method 2: Bin Data in Pandas Using the “qcut()” Method
In Python, the “pandas.qcut()” method is used to divide the number of values of each bin into equal intervals, as It is a Quantile-based discretization function.
Syntax
Parameters
Here:
- The “x” parameter represents the unidimensional array and the “q” parameter represents the number of quantiles.
- The “labels” parameter indicates the refilled bins labels. The size of the labels and the generated bins must be equivalent.
- The “retbins”, “precision” and “duplicates” parameters specify whether the bins retired or not, the precision of bins while computing, and how to handle the duplicates bin’s edges.
Return Value
The “pandas.qcut()” method retrieves the “ndarray” of floats only if retbins is “True”. This will also retrieve a categorical or series or array of integers if the label is “False”.
Example 1: Bin Pandas DataFrame Data
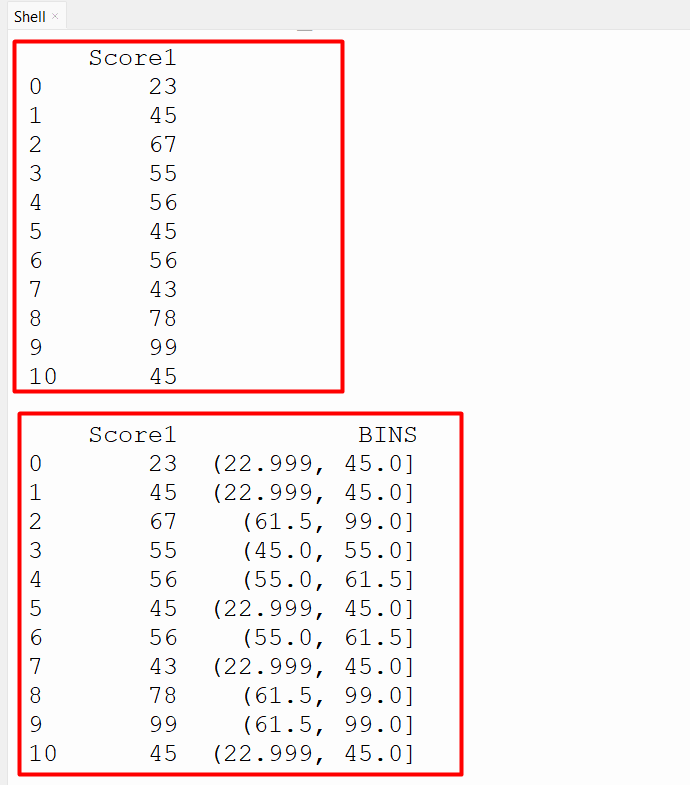
In this code, we imported the Pandas module and constructed the DataFrame. After that, the “pandas.qcut()” method takes the column and bin value as an argument to divide the data set by 4 quantiles:
df=pandas.DataFrame({'Score1':[23,45,67,55,56,45,56,43,78,99,45]})
print(df, '\n')
df['BINS'] = pandas.qcut(df['Score1'], 4)
print(df,'\n')
The below output verifies that each quantile has an equal number of values:
Example 2: Difference Between “pandas.cut()” and “pandas.qcut()” Method
The prominent distance between the “pandas.cut()” and “pandas.qcut()” method is the way to create bins for data binning. The “pandas.cut()” method creates bins equal in width or based on the input boundary values. This method divides the values range into a specified number of equivalent-sized intervals or bins.
The “pandas.qcut()” method is used to create bins of equal frequency or based on sample quantiles. It divides the data into intervals that contain an equal number of data points or have an equal probability density. Here is a code that displays the difference between the “pandas.cut()” method and the “pandas.qcut()” method:
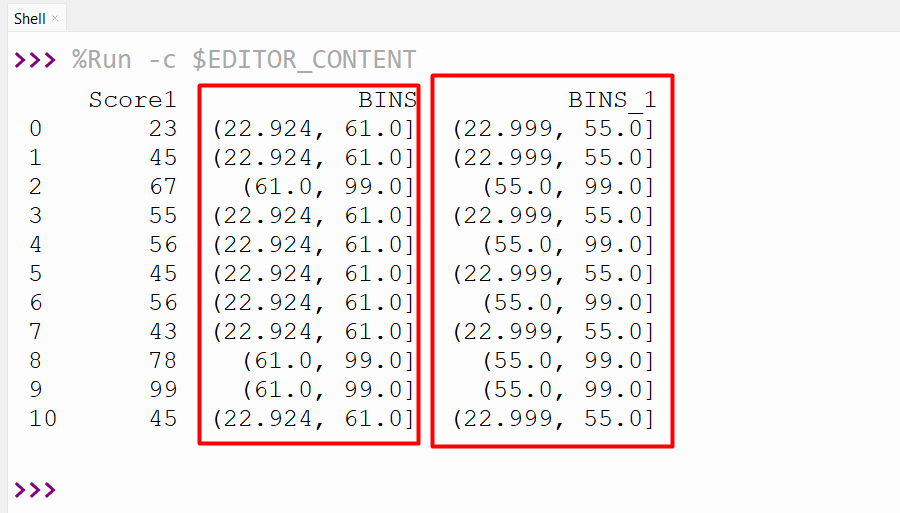
df=pandas.DataFrame({'Score1':[23,45,67,55,56,45,56,43,78,99,45]})
df['BINS'] = pandas.cut(df['Score1'], bins=2)
df['BINS_1'] = pandas.qcut(df['Score1'], 2)
print(df,'\n')
The below output states that pandas.cut() bins the data based on the two bins (22.924, 61.0] and (61.0, 99.0]. While the pandas.qcut() bins the value based on the sample quantiles:
Conclusion
In Python, the “pandas.cut()” and “pandas.qcut()” method is used to create the bins based on the input boundary values or based on the sample quantiles. We can also label the bins or specify the number of decimal places while creating bins of Pandas DataFrame columns. This blog delivered an overview of Pandas bins utilizing numerous examples.