Normalization of data is a technique that helps to get the result faster as the machine has to process a smaller range of data. Normalization is not an easy task because all your results depend upon the choice of your normalize method. So, if you have chosen the wrong method to normalize your data, you might get something different from your expectations.
The normalization also depends upon the data type like images, text, numeric, etc. So, every data type has a different method to normalize. So, in this article, we are focusing on numeric data.
Method 1: Using sklearn
The sklearn method is a very famous method to normalize the data.
import numpy as np
numpy_array = np.array([2, 3, 5, 6, 7, 4, 8, 7, 6, 17, 18, 19, 2, 1, 89])
normalized_array = preprocessing.normalize([numpy_array])
print(normalized_array)
Result:
We import all the required libraries, NumPy and sklearn. You can see that we import the preprocessing from the sklearn itself. That’s why this is the sklearn normalization method.
We created a NumPy array with some integer value that is not the same.
We called the normalize method from the preprocessing and passed the numpy_array, which we just created as a parameter.
We can see from the results, our all integer data are now normalized between 0 and 1.
Method 2: Normalize a particular column in a dataset using sklearn
We can also normalize the particular dataset column. In this, we are going to discuss about that.
from sklearn import preprocessing
import numpy as np
csvFile = pd.read_csv("demo.csv")
print(csvFile)
value_array = np.array(csvFile['value'])
print(value_array)
normalized_array = preprocessing.normalize([value_array])
print(normalized_array)
Result:
We import the library pandas and sklearn.
We created a dummy CSV file, and we are now loading that CSV file with the help of the pandas (read_csv) package.
We print that CSV file which we recently loaded.
We read the particular column of the CSV file using the np. array and store the result to value_array.
We called the normalize method from the preprocessing and passed the value_array parameter.
Method 3: Convert to normalize without using the columns to array (using sklearn)
In the previous method 2, we discussed how to a particular CSV file column we could normalize. But sometimes we need to normalize the whole dataset, then we can use the below method where we do normalize the whole dataset but along column-wise (axis = 0). If we mention the axis = 1, then it will do row-wise normalize. The axis = 1 is by default value.
from sklearn import preprocessing
csvFile = pd.read_csv("demo_numeric.csv")
print(csvFile)
# Normalize the data along columnwise (axis = 0)
result = preprocessing.normalize(csvFile, axis=0)
print(result)
Result:
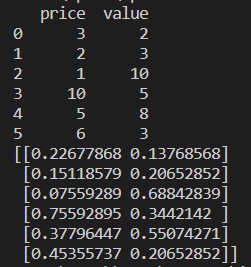
We import the library pandas and sklearn.
We created a dummy CSV file (demo_numeric.csv), and we are now loading that CSV file with the help of the pandas (read_csv) package.
We print that CSV file which we recently loaded.
Now, we pass the whole CSV file along with one more extra parameter axis =0, which said to the library that the user wanted to normalize the whole dataset column-wise.
We print the result and normalize data with a value between 0 and 1.
Method 4: Using MinMaxScaler()
The sklearn also provides another method of normalization, which we called it MinMaxScalar. This is also a very popular method because it is easy to use.
from sklearn import preprocessing
csvFile = pd.read_csv("demo_numeric.csv")
print(csvFile)
min_max_Scalar = preprocessing.MinMaxScaler()
col = csvFile.columns
result = min_max_Scalar.fit_transform(csvFile)
min_max_Scalar_df = pd.DataFrame(result, columns=col)
print(min_max_Scalar_df)
Result:
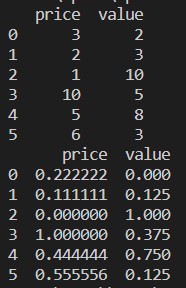
We import all the required packages.
We created a dummy CSV file (demo_numeric.csv), and we are now loading that CSV file with the help of the pandas (read_csv) package.
We print that CSV file which we recently loaded.
We called the MinMaxScalar from the preprocessing method and created an object (min_max_Scalar) for that. We did not pass any parameters because we need to normalize the data between 0 and 1. But if you want, you can add your values which will be seen in the next method.
We first read all the names of the columns for further use to display results. Then we call the fit_tranform from the created object min_max_Scalar and passed the CSV file into that.
We get the normalized results which are between 0 and 1.
Method 5: Using MinMaxScaler(feature_range=(x,y))
The sklearn also provides the option to change the normalized value of what you want. By default, they do normalize the value between 0 and 1. But there is a parameter which we called feature_range, which can set the normalized value according to our requirements.
from sklearn import preprocessing
csvFile = pd.read_csv("demo_numeric.csv")
print(csvFile)
min_max_Scalar = preprocessing.MinMaxScaler(feature_range=(0, 2))
col = csvFile.columns
result = min_max_Scalar.fit_transform(csvFile)
min_max_Scalar_df = pd.DataFrame(result, columns=col)
print(min_max_Scalar_df)
Result:
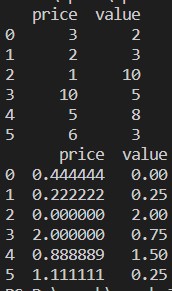
We import all the required packages.
We created a dummy CSV file (demo_numeric.csv), and we are now loading that CSV file with the help of the pandas (read_csv) package.
We print that CSV file which we recently loaded.
We called the MinMaxScalar from the preprocessing method and created an object (min_max_Scalar) for that. But we also pass another parameter inside of the MinMaxScaler (feature_range). That parameter value we set 0 to 2. So now, the MinMaxScaler will normalize the data values between 0 to 2.
We first read all the names of the columns for further use to display results. Then we call the fit_tranform from the created object min_max_Scalar and passed the CSV file into that.
We get the normalized results which are between 0 and 2.
Method 6: Using the maximum absolute scaling
We can also do normalize the data using pandas. These features are also very popular in normalizing the data. The maximum absolute scaling does normalize values between 0 and 1. We are applying here .max () and .abs() as shown below:
# create a demo dataframe
df = pd.DataFrame([
[380000, 610, 187.9],
[860000, 705, 237.4],
[430000, 130, 147.0],
[60000, 150, 137.5]],
columns=['A', 'B', 'C'])
print(df)
# Normalized method
for column in df.columns:
df[column] = df[column] / df[column].abs().max()
print(df)
Result:
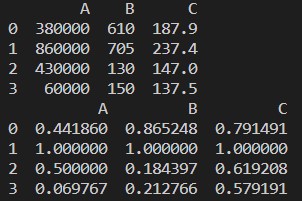
We import the pandas’ library.
We created a dummy dataframe and printed that dataframe.
We call each column and then divide the column values with the .max() and .abs().
We print the result, and from the result, we confirm that our data normalize between 0 and 1.
Method 7: Using the z-score method
The next method which we are going to discuss is the z-score method. This method converts the information to the distribution. This method calculates the mean of each column and then subtracts from each column and, at last, divides it with the standard deviation. This normalizes the data between -1 and 1.
# create a demo dataframe
df = pd.DataFrame([
[380000, 610, 187.9],
[860000, 705, 237.4],
[430000, 130, 147.0],
[60000, 150, 137.5]],
columns=['A', 'B', 'C'])
print(df)
# Normalized method
for column in df.columns:
df[column] = (df[column] - df[column].mean()) / df[column].std()
print(df)
Result:
We created a dummy dataframe and printed that dataframe.
We calculate the column’s mean and subtract it from the column. Then we divide the column value with the standard deviation.
We print the normalized data between -1 and 1.
Conclusion: We have seen different kinds of normalized methods. Among them, sklearn is very famous because of supporting machine learning. But that depends upon the requirements of the user. Sometimes pandas feature to normalize data is sufficient. We cannot say that there are only above normalize methods. There are numerous methods to do data normalization that also depend upon your data type like images, numeric, text, etc. We focus on this numeric data and Python.


