Monitoring Raspberry Pi System using InfluxDB, Telegraf and Grafana
To perform system monitoring, install the following tools:
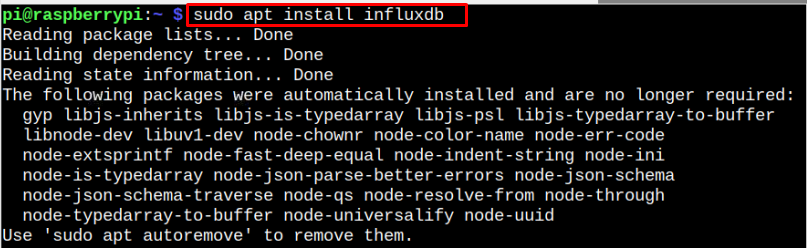
Install InfluxDB on Raspberry Pi
To install the InfluxDB database system from the Raspberry Pi repository, run the below-mentioned command:
After the installation, check the InfluxDB status using the following command:

The active (running) status confirms InfluxDB is running without any issue.
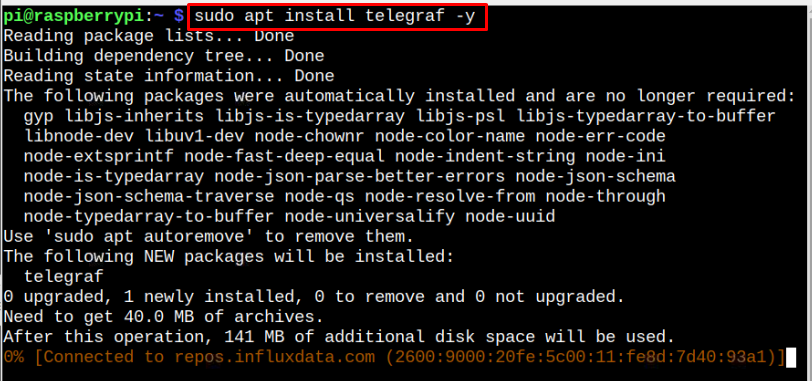
Install Telegraf on Raspberry Pi
Telegraf is a server agent used to collect metric information and it can be installed using the following steps:
Step 1: First, download the InfluxDB key from the following command:
Step 2: Add the InfluxDB key to Raspberry Pi using the following command:
Step 3: Now, add the Telegraf repository to the Raspberry Pi source list using the following command:
Step 4: To ensure the repository is successfully added, update the Raspberry Pi repository through the update command mentioned below:

Step 5: After the update, install Telegraf on Raspberry Pi via the following command:
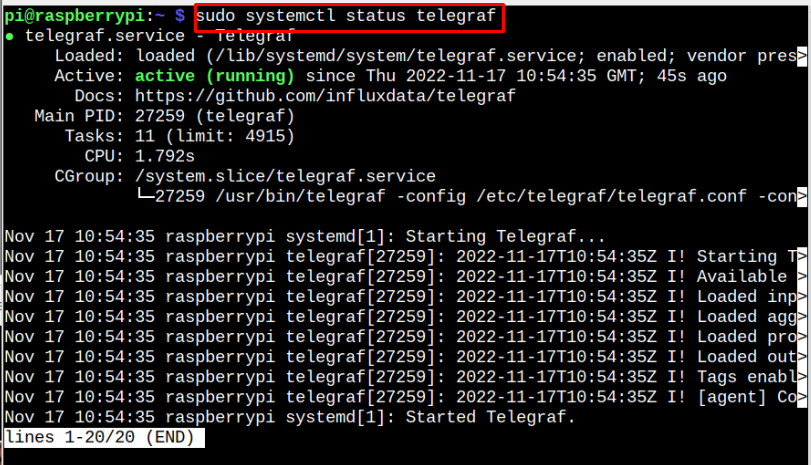
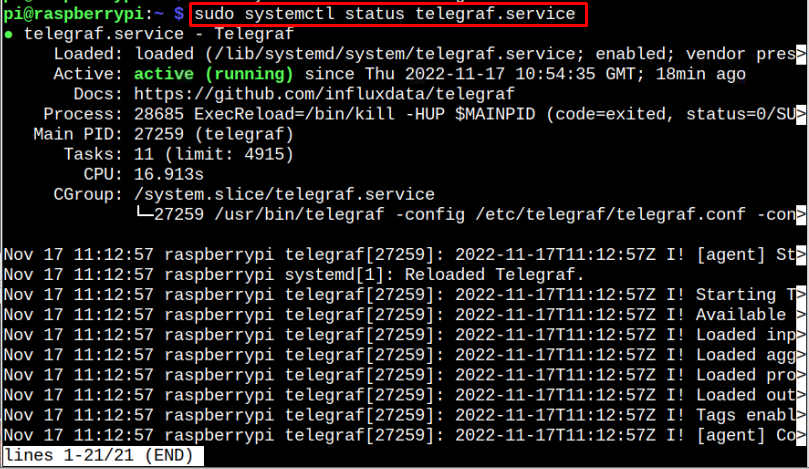
To ensure Telegraf service is running, you must run the following command:
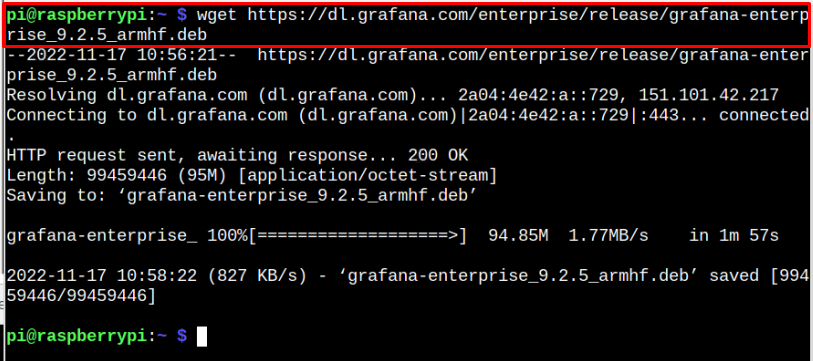
Install Grafana on Raspberry Pi
The final installation tool is Grafana, which is a system monitoring tool that displays the result on the web interface. To install Grafana on Raspberry Pi, follow the below-given steps:
Step 1: Download Grafana’s latest version deb package for Raspberry Pi through the following command:
Visit the website here to download Grafana according to your system architecture.
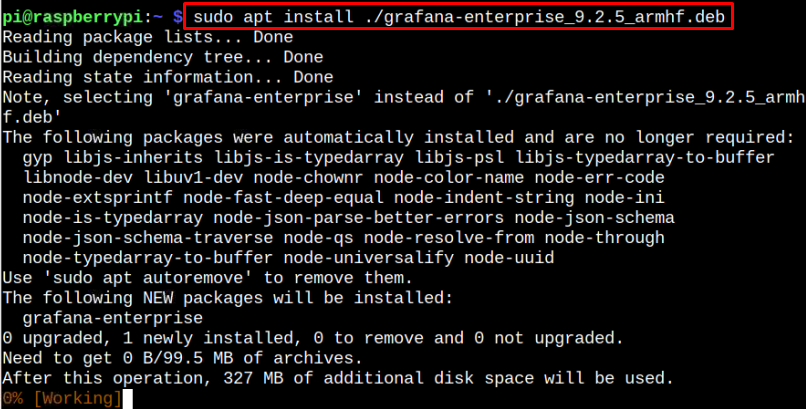
Step 2: To install Grafana on Raspberry Pi through the deb package, use the following command:
After the installation, you have to start the Grafana service on Raspberry Pi from the following command:
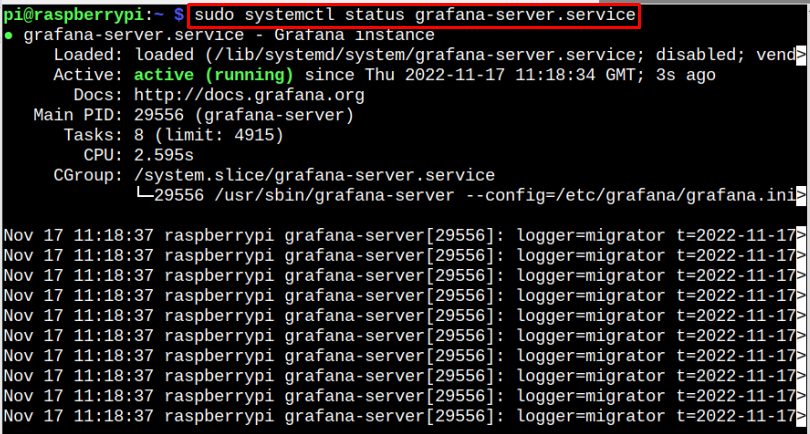
Confirm the active running status of Grafana on Raspberry Pi through the following command:
Create a Database for Grafana
After installing all the tools, you must create a database using the InfluxDB database system, which is supported by Grafana. To create a database using InfluxDB, follow the below-mentioned steps:
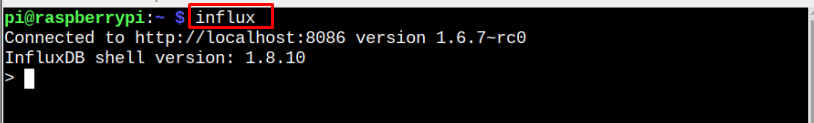
Step 1: Open the InfluxDB database from the following command:
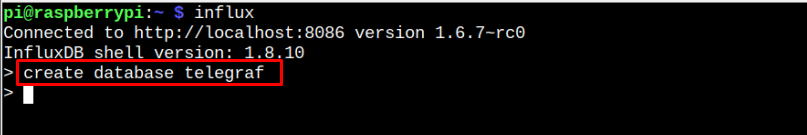
Step 2: Create a database name “telegraf” using the following syntax:
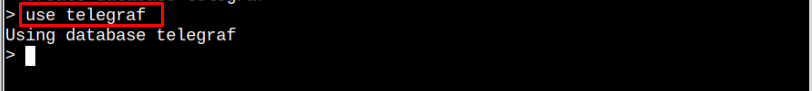
Step 3: Run the following syntax to use the Telegraf database.
Step 4: You must create a username and set a password for your database using the following syntax:
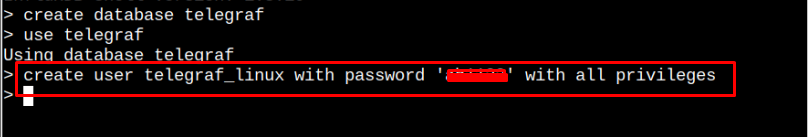
Step 5: Now grant all privileges using the following syntax:

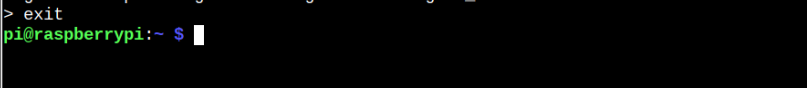
Step 6: Exit the database through the “exit” command to complete the database setup.
Configure Telegraf File
Before moving towards the Grafana dashboard, you must perform the following steps to configure the Telegraf file on Raspberry Pi.
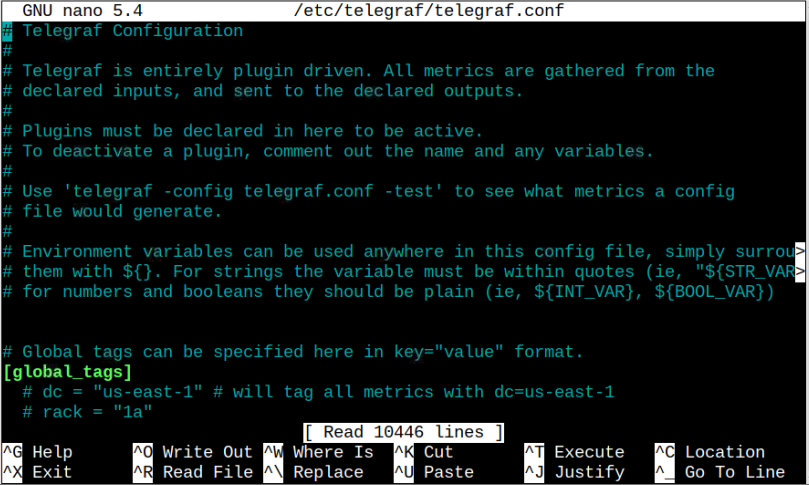
Find the following lines inside the file and uncomment them accordingly. However, instead of searching for these lines inside the file, you can manually add them anywhere inside the file:
urls = ["http://127.0.0.1:8086"]
database = "telegraf"
username = "database_user"
password = "database_password"
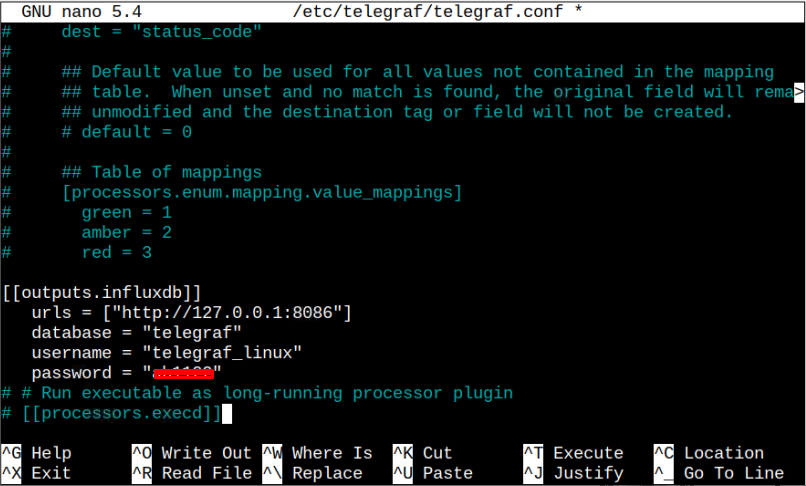
Make sure to replace the username and password then save the file using “CTRL+X”.
Reload the Telegraf service via the following command:
To check whether the changes you made are successfully applied, run the following command:
Access Grafana Web Interface
Go to Chromium browser on Raspberry Pi and enter the address “localhost:3000” to open the Grafana dashboard.
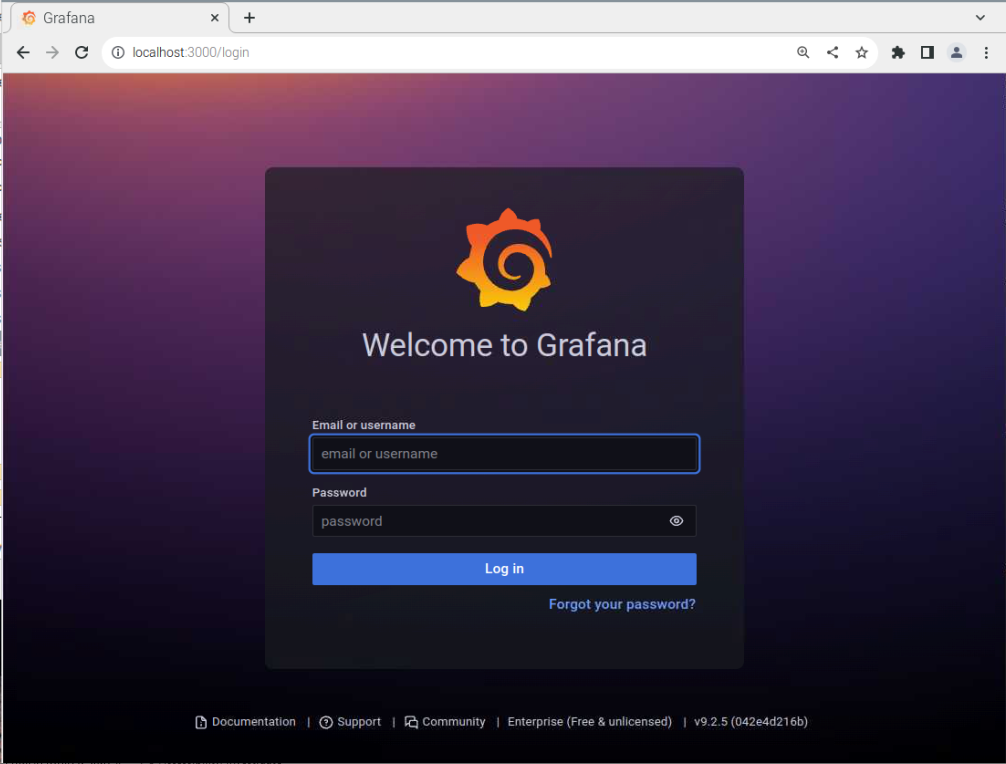
Login to Grafana with the username and password (the default is “admin” in both cases).
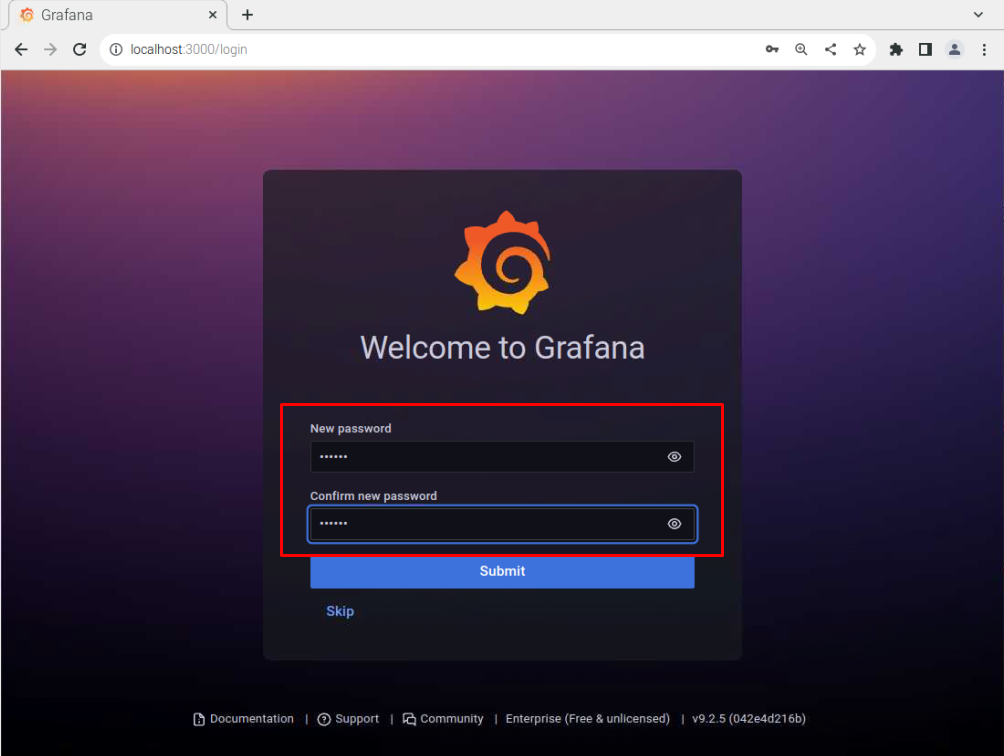
You must change the password in the next onscreen window.
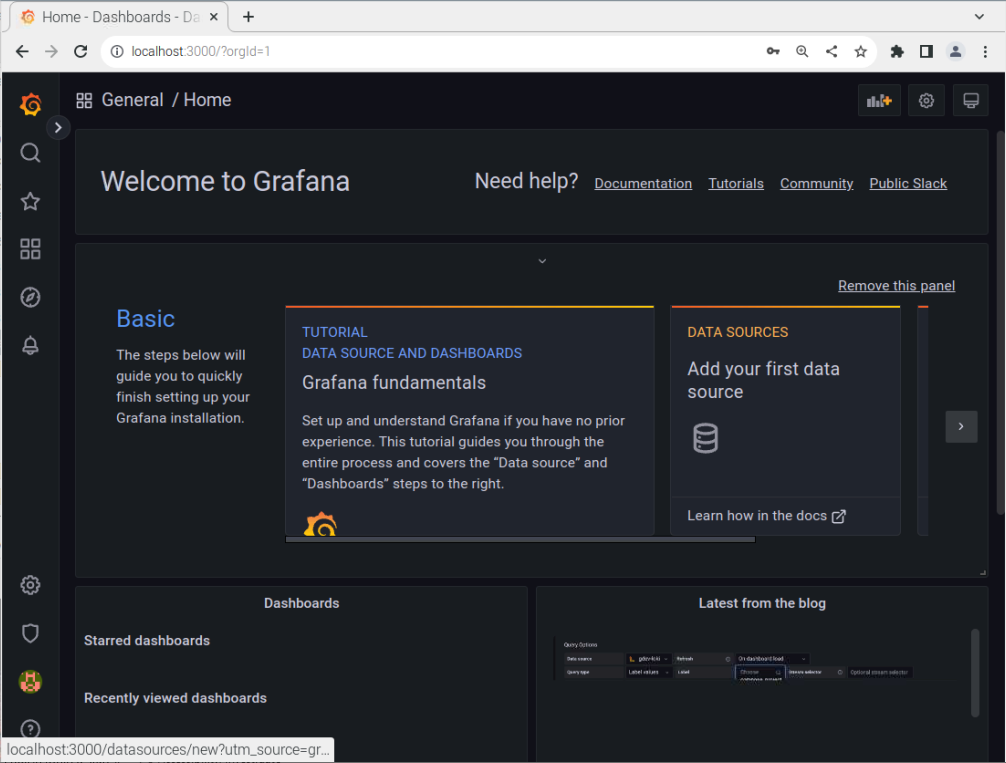
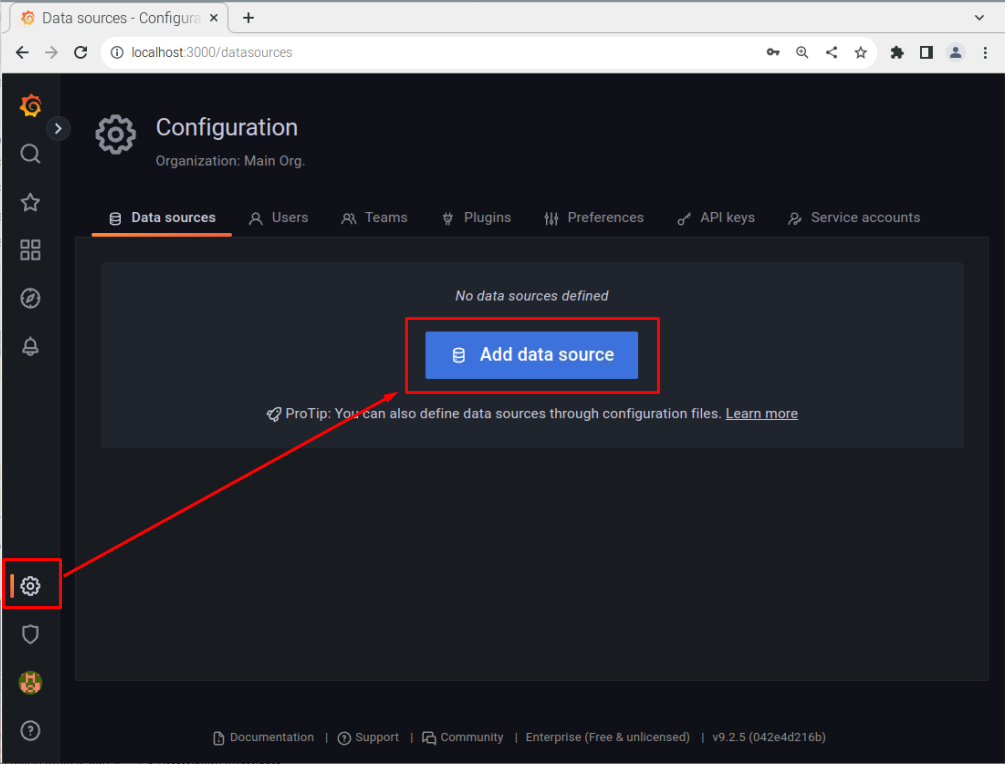
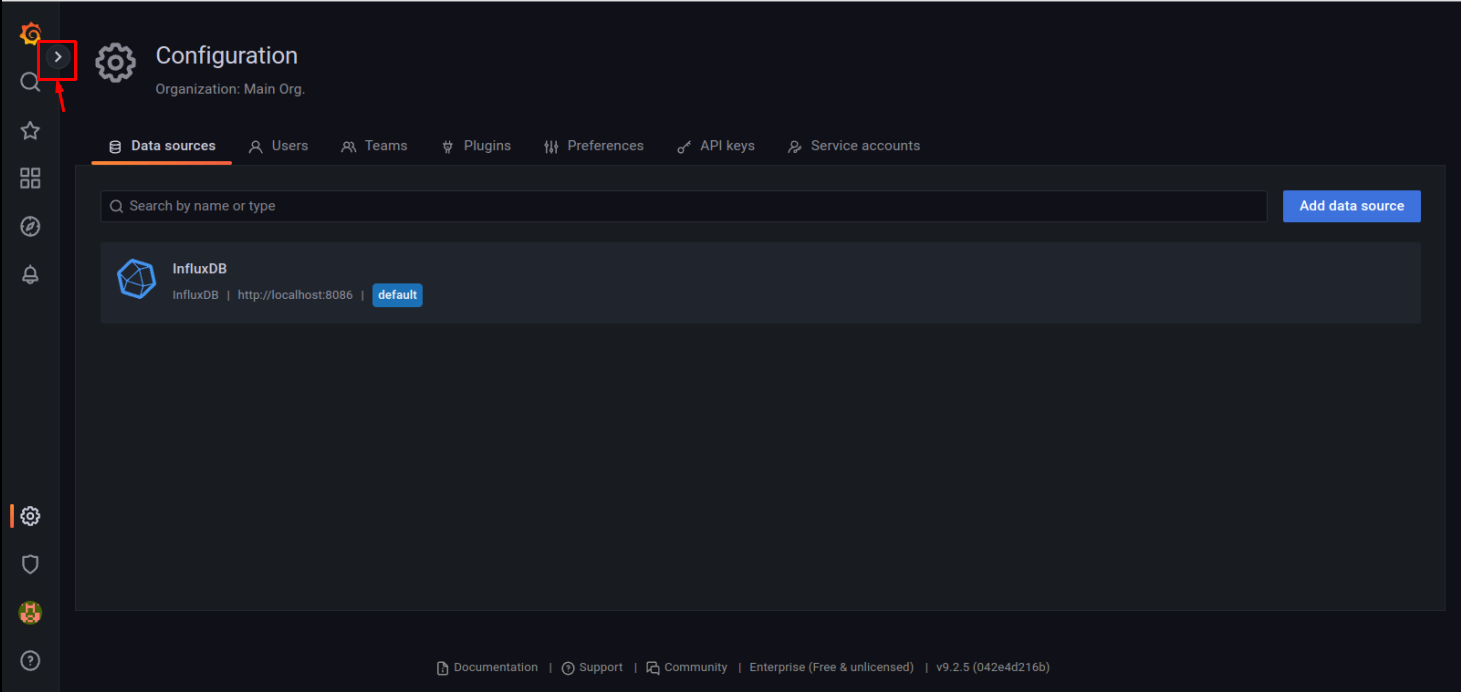
Go to the “Configuration Settings” option on the Grafana dashboard and click on the “Add data source” button.
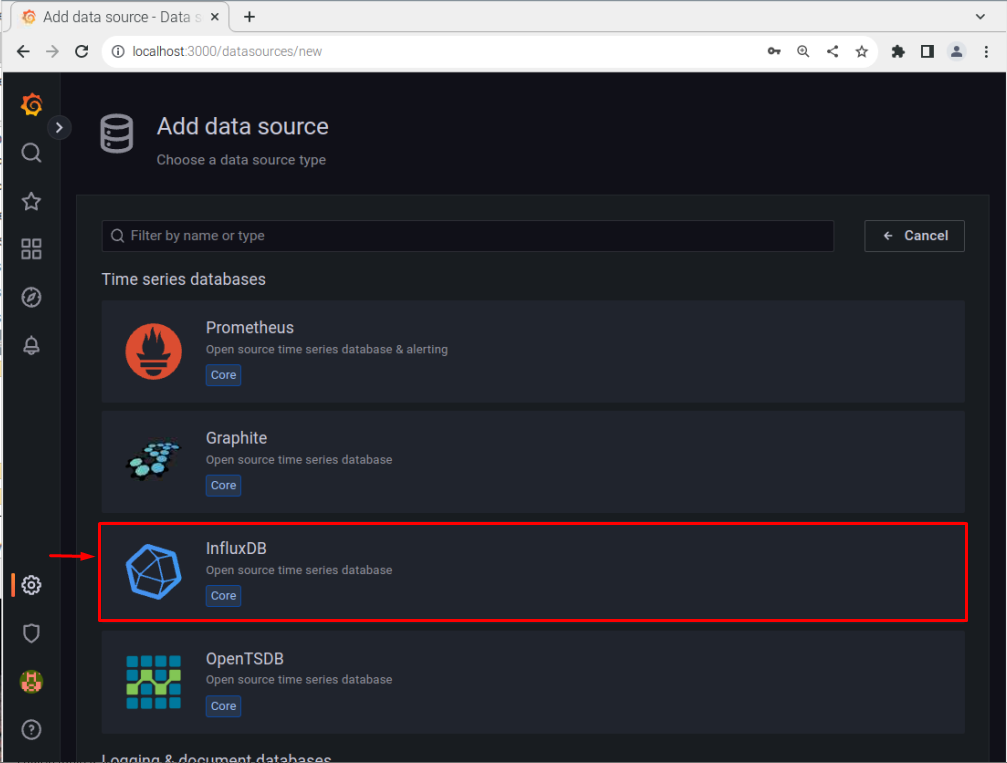
Select InfluxDB as a data source.
Fill the http section with the “local address” and port number “8086”.
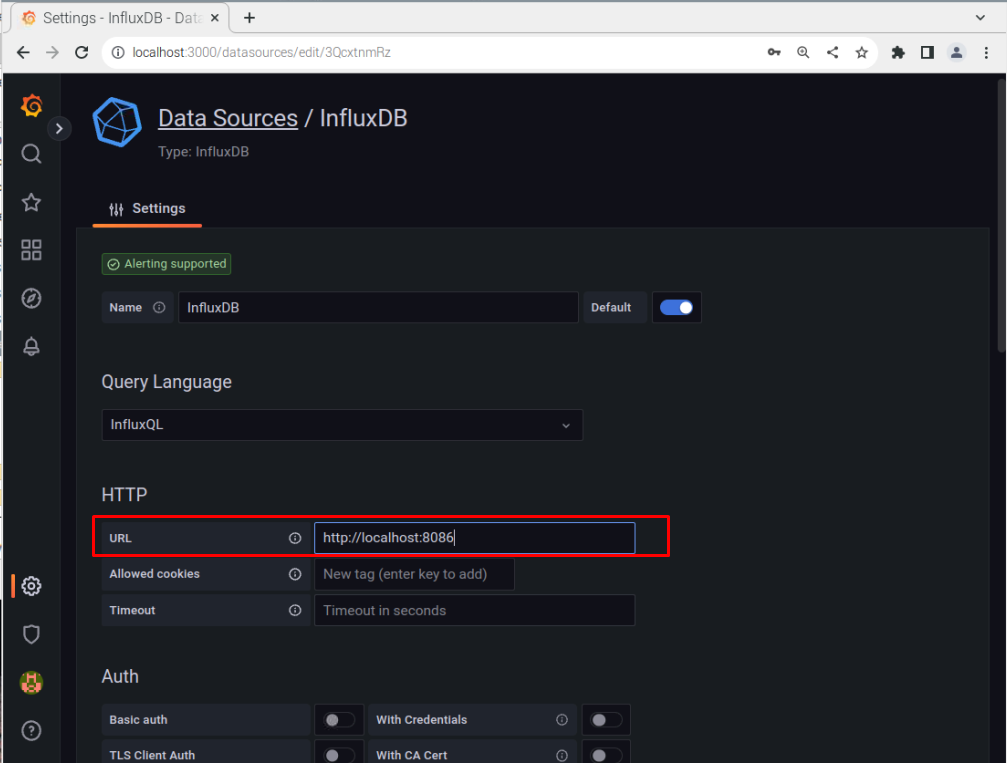
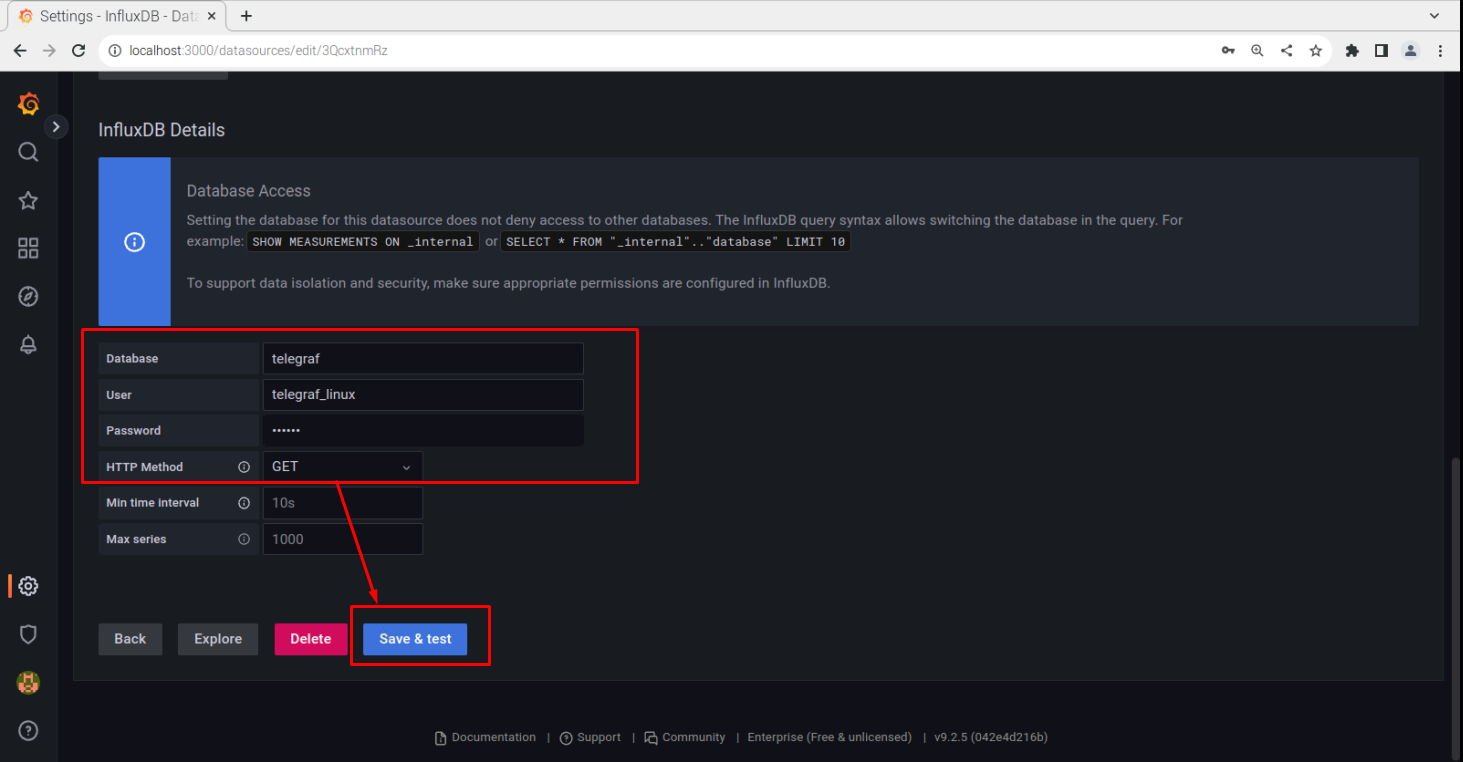
Scroll down and add your database information, which we created earlier and then click on the “Save & test” button to add the database to Grafana.
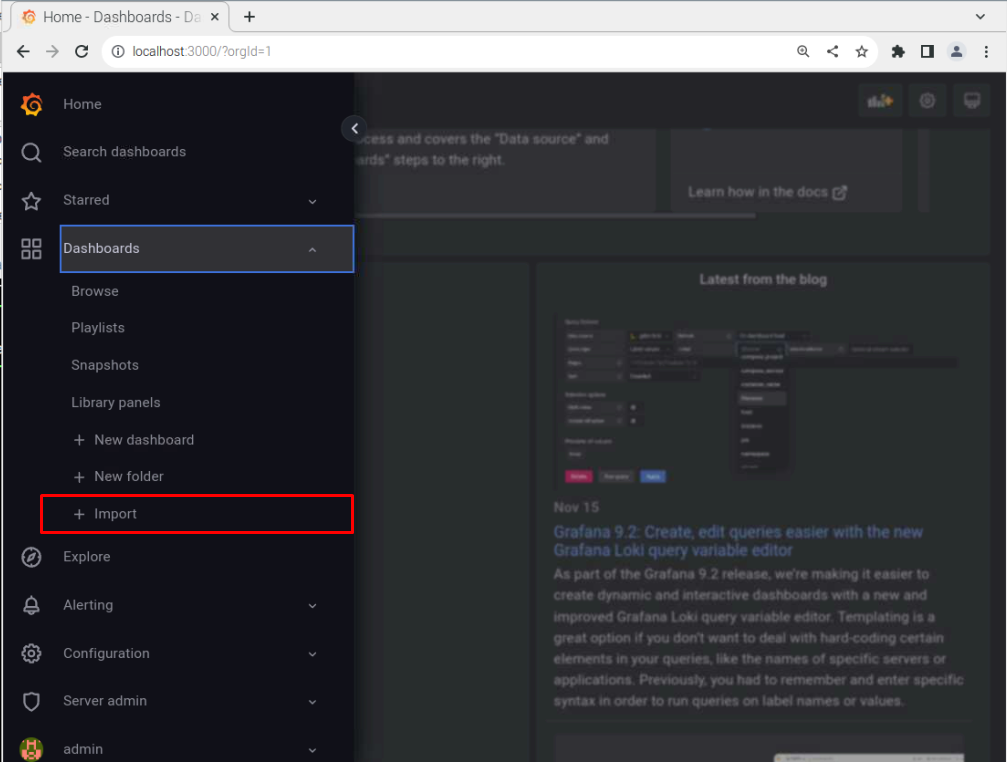
Now click the “arrow” icon right in front of the “Search” option:
Click on the “Import” option.
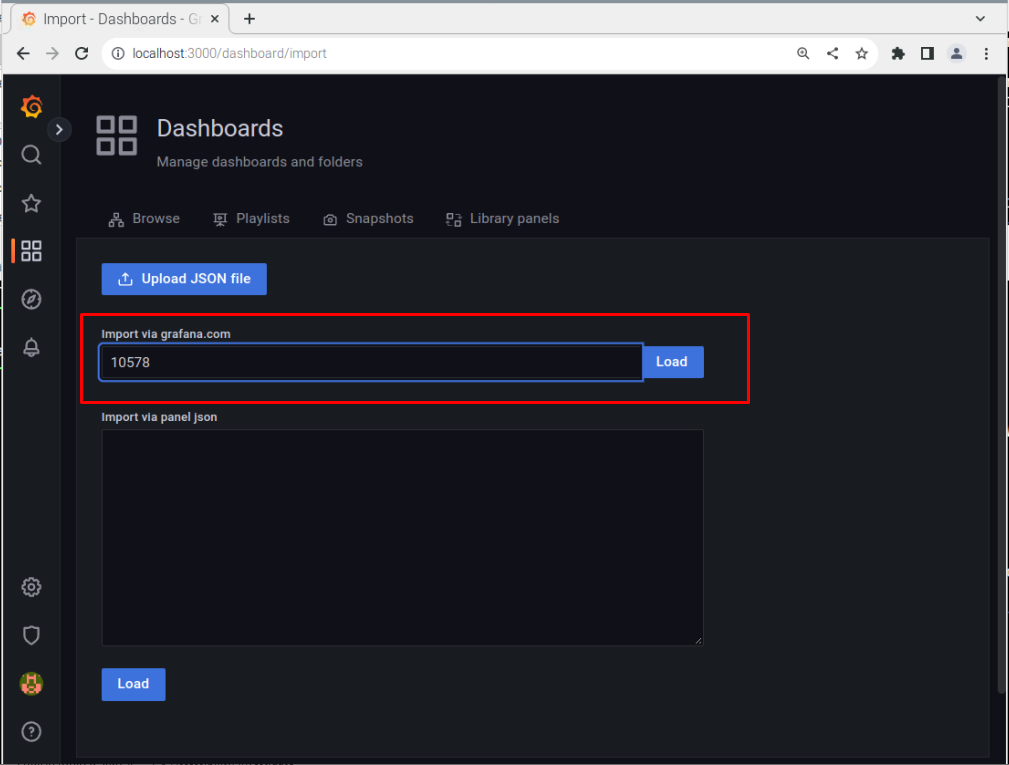
Add the ID “10578” and select the “Load” button.
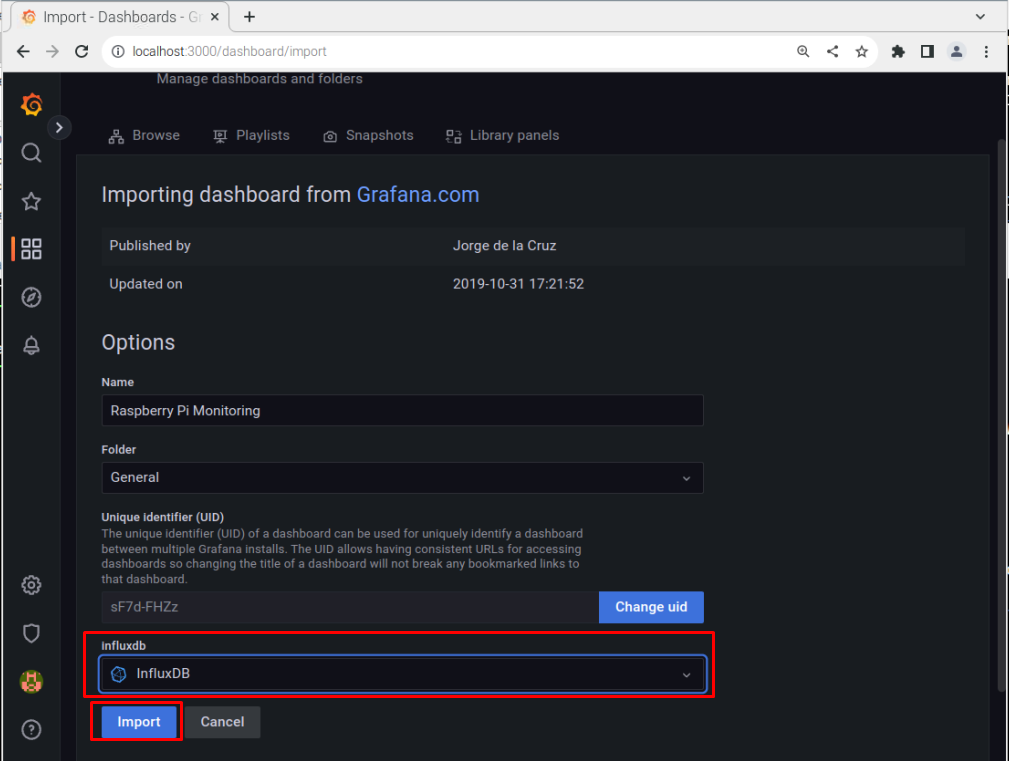
Scroll down, select the “InfluxDB” option and then click on the “Import” button.
Reload the Grafana web page to see your Raspberry Pi system information.
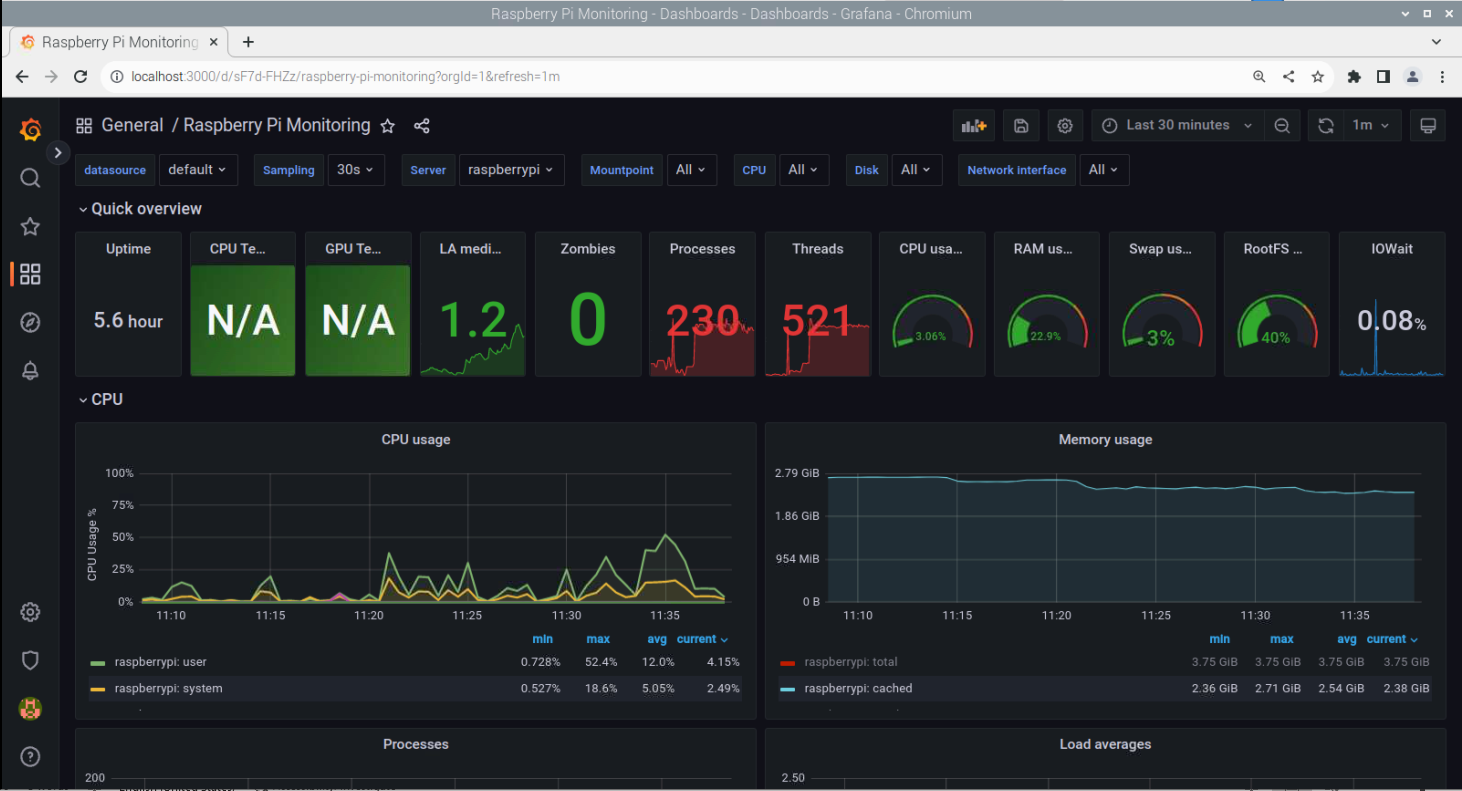
At this point, you have successfully set up the Raspberry Pi system monitoring process using InfluxDB, Telegraf and Grafana.
Conclusion
Raspberry Pi system monitoring is handy since it allows users to check their system performance. With InfluxDB, Telegraf and Grafana, users can perform system monitoring tasks successfully. The guidelines mentioned above will surely help you set up your system monitoring process and you should do it on your system to get detailed system information like CPU usage, RAM and more.