Matplotlib modifies the background hue of the graph by using the set_facecolor() function:
We utilize the set_facecolor() function to adjust the background hue of the graph. The following program shows how to utilize this function to set the shade of the background.
plt.rcdefaults()
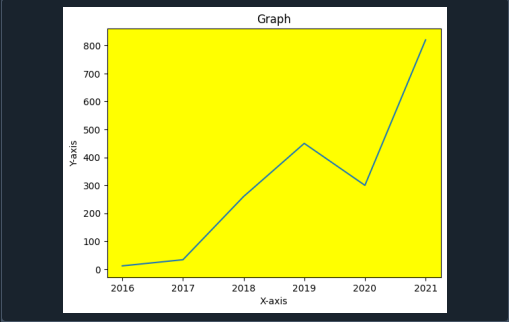
emp = [12, 34, 260, 450, 300, 820]
year = [2016, 2017, 2018, 2019, 2020, 2021]
fig, ax = plt.subplots()
ax.plot(year, emp)
ax.set_xlabel("X-axis")
ax.set_ylabel("Y-axis")
ax.set_title("Graph")
ax.set_facecolor("yellow")
plt.show()
For code execution, we have to first introduce the library matplotlib.pyplot as plt. We specify the graph configuration by calling the plt.rcdefaults() function. Now we define the number of workers in the company. We declare an array for this purpose.
Similarly, we create another array for storing the years. Further, we create an object for the figure, and also we apply the ax.plot() function to draw the graph. This function holds two arguments: years and number of workers. We have to set the labels for both the x-axis and y-axis by applying the function set_label() separately on both axes.
We utilize the set_title() function to define the graph’s title. Now we specify the color of the background of the graph, so we call the ax.set_facecolor() method. It contains only one parameter that shows the name of the color of the graph. After all this, we simply display the graph with the plt.show() function.
Adjust the background tint for multiple graphs in matplotlib:
We can set the background hue of multiple graphs by providing the axes.facecolor parameter to the rc.Params object.
plt.rcParams['axes.facecolor'] = 'g'
plt.subplot(1,2, 1)
plt.plot(range(4), range(6, 10))
plt.subplot(1,2, 2)
plt.plot(range(4), range(10, 6, -1))
plt.show()
We have to import package matplotlib.pyplot as plt for the graphic visualizations. Now we create an object termed ‘rc.Params’. And we specify the color of the background by declaring the ‘axes.facecolor’ element to this object.
Here we create two subplots() by calling function plt.subplot() for the first and second subplot. We also defined the range of the x-axis and y-axis for both subplots. In the end, we apply the plt.show() function to represent the plot.
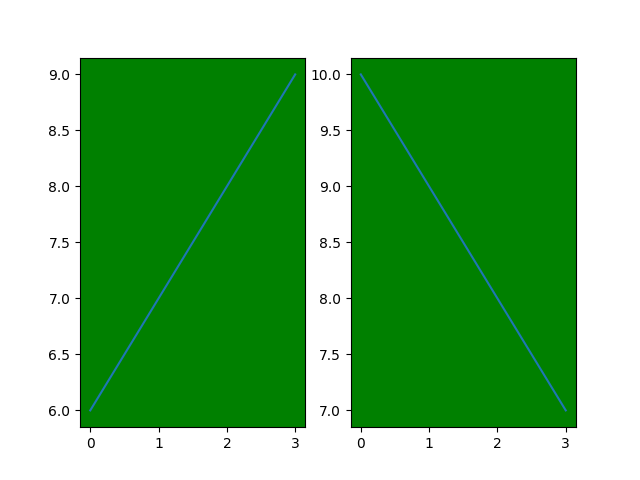
In the output, we obtain two subplots with the background’s green color.
Adjust the graph Background Color by the use of Hexadecimal Color Code:
In this step, we notice how to change the background hue by the usage of the hexadecimal code of the color.
fig, ax = plt.subplots()
m = [15, 24, 17, 4, 20, 7]
n = [22, 7, 17, 16, 24, 6]
ax.scatter(m, n)
ax.set_facecolor('#1CC4AF')
plt.show()
At the start of the code, we integrate the library, which is required for setting the background color. We specify the figure and axis of the graph, so we make an object of the figure. Now we will give the values to the x-axis and y-axis of the graph, so we declare two different arrays. These elements of the arrays are stored in variables.
We have to create the scatter graph by calling the ax.scatter() function. The arrays we defined just above are provided as an argument to the scatter() function. Further, we defined the color of the graph background.
Here we utilize the hexadecimal code of the color. This parameter of ‘color’ is given to the facecolor() method. At the termination of the code, we have to display the scatter graph by using the plt.show() method.
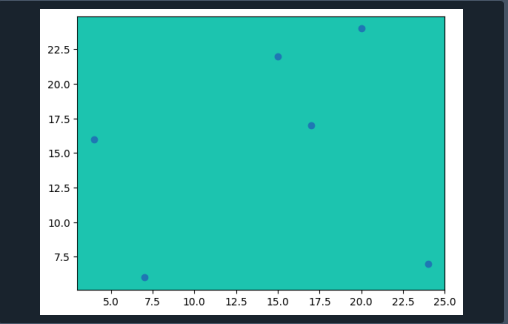
Here we get the scatter graph having blue base color.
Matplotlib set the background tint transparent by the use of the alpha() function:
The set alpha() function is required when we want to change the base color of the graph. It makes the axes translucent or makes the graph region translucent.
x = [20, 40, 60, 80, 100, 110]
y = [5, 10, 15, 20, 25, 30]
fig = plt.figure()
fig.patch.set_facecolor('red')
fig.patch.set_alpha(0.9)
ax = fig.add_subplot(111)
ax.patch.set_facecolor('blue')
ax.patch.set_alpha(0.5)
plt.scatter(x,y)
plt.show()
The required library matplotlib is imported first for visual analytics. We take two variables, and then we declare arrays that contain the datasets of the x and y-axis. These arrays are stored in variables.
In the next step, we call plt.figure() function to draw the graph. We can adjust the background color of the graph with the help of a fig. patch.set_facecolor() function. And similarly, we define the transparency of the graph. For this purpose alpha() method is called. We can provide any floating-point number to the alpha for setting the transparency.
In addition to this, we insert another plot into the first one. The graph is drawn by the fig.add_subplot() function. The outer background hue is defined by the set_facecolor() method. We utilize the set_alph () function to define the transparency of axes.
We apply the plt.scatter() method to display the scatter. And to represent the graph by using the plt.show() function.
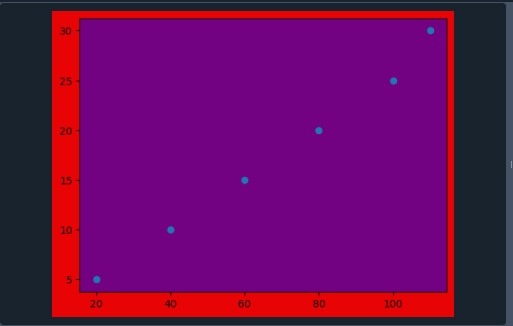
After executing the above code, we get this type of output. This graph contains the outer background and inner background. We specified a 0.5 value to the alpha for the graph background and axis region. So it shows that both regions are completely dense. We could also adjust the value of alpha by reducing it.
Conclusion:
In this article, we’ve covered numerous methods for adjusting the background of a graph in Python and Matplotlib, along with examples. In matplotlib, we define the graphic base color for many figures. We also go through how to select the base color while utilizing Hexadecimal coloring code. Lastly, we have looked at the method of making the graph background hue translucent.