What is Linear Regression?
In data science, Linear Regression is a supervised machine learning model that attempts to model a linear relationship between dependent variables (Y) and independent variables (X). Every evaluated observation with a model, the target (Y)’s actual value is compared to the target (Y)’s predicted value, and the major differences in these values are called residuals. The Linear Regression model aims to minimize the sum of all squared residuals. Here is the mathematical representation of the linear regression:
Y= a0+a1X+ ε
In the above equation:
Y = Dependent Variable
X = Independent Variable
a0 = Intercept of the line that offers additional DOF or degree of freedom.
a1 = Linear regression coefficient, which is a scale factor to every input value.
ε = Random error
Remember that the values of X and Y variables are training datasets for the model representation of linear regression.
When a user implements a linear regression, algorithms start to find the best fit line using a0 and a1. In such a way, it becomes more accurate to actual data points; since we recognize the value of a0 and a1, we can use a model for predicting the response.
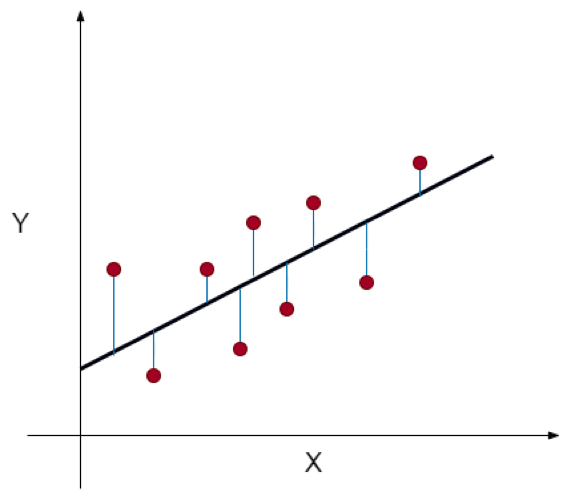
- As you can see in the above diagram, the red dots are observed values for both X and Y.
- The black line, which is called a line of best fit, minimizes a sum of a squared error.
- The blue lines represent the errors; it is a distance between the line of best fit and observed values.
- The value of the a1is the slope of the black line.
Simple Linear Regression
This type of linear regression works by using the traditional slope-intercept form in which a and b are two coefficients that are elaborated “learn” and find the accurate predictions. In the below equation, X stands for input data, and Y stands for prediction.
Y= bX + a
Multivariable Regression
A multivariable regression is a bit more complex than other procedures. In the below equation, 𝒘 stands for the weights or coefficient which requires to be elaborated. All variables 𝑥1, 𝑥2, and 𝑥3 information attributes of the observations.
House Price Prediction Using Linear Regression
Now let’s consider every step for the house price prediction using linear regression. Consider a company of real estate with datasets containing the property prices of a specific region. The price of a property is based on essential factors like bedrooms, areas, and parking. Majorly, a real estate company requires:
- Find the variable that affects the price of a house.
- Creating a linear model quantitatively related to the house price with variables like areas, number of rooms and bathroom, etc.
- For finding the accuracy of a model, that means how well the variables can predict the prices of a house.
Below is the code to set up the environment, and we are using scikit-learn to predict the house price:
import numpy as np
import seaborn as sns
import matplotlib.pyplot as plt
%matplotlib inline
from sklearn.linear_model import LinearRegression
from sklearn.model_selection import train_test_split, cross_val_score
from sklearn.metrics import mean_squared_error
After that, read the prices data of the house:
houses.head()
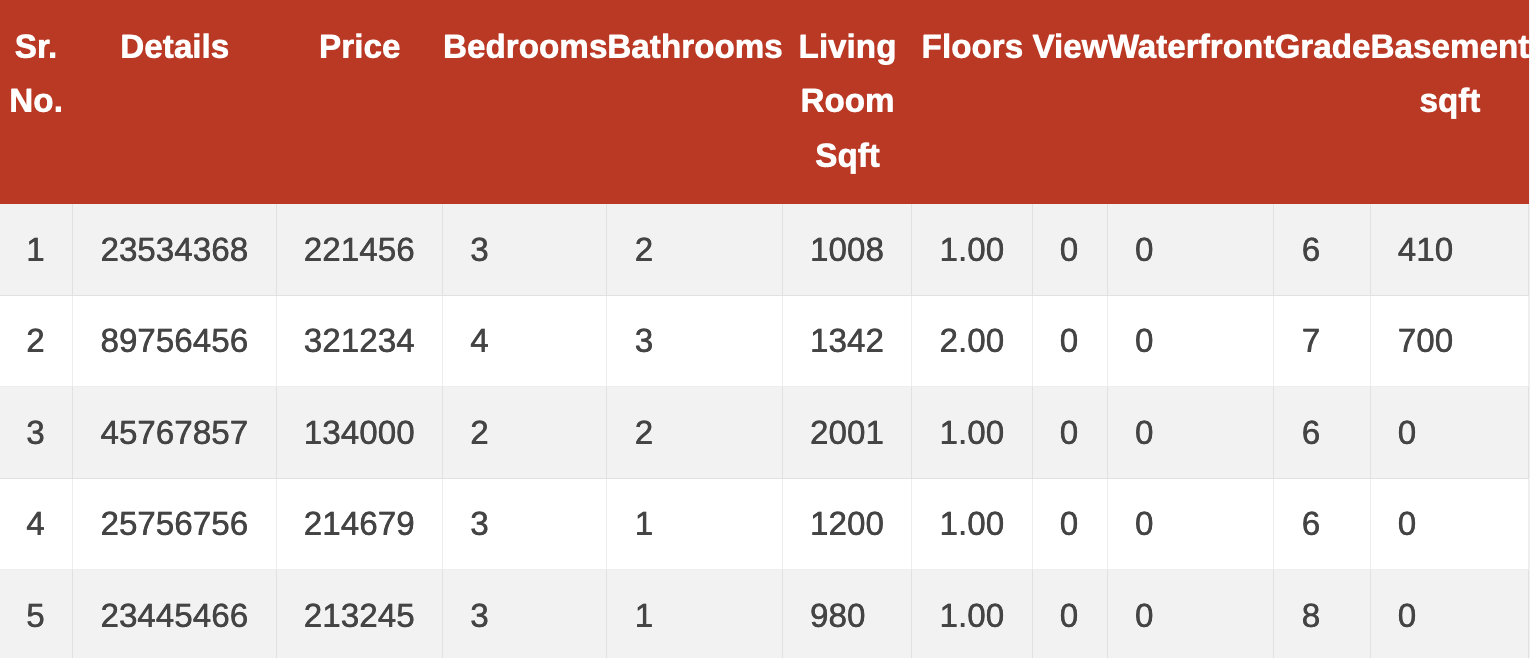
Here is the table with the complete details (data set) of different houses:
Now, we will perform the data cleansing and the exploratory analysis using the below code:
houses.isnull().sum()
According to the dataset, there are not nulls available:
date 0
price 0
bedrooms 0
bathrooms 0
sqft_living 0
floors 0
waterfront 0
view 0
condition 0
grade 0
sqft_basement 0
yr_built 0
yr_renovated 0
zip code 0
lat 0
long 0
Sqft_living 15 0
Sqft_lot 15 0
Dtype: int64
After that, we build a linear regression model. Prepare the data which will define the predictor and response variable:
feature_cols = 'sqft_living'
x = houses[feature_cols] # predictor
y = houses.price # response
We can split data into the train and test; the train or test split presents two randomly created subsets of our data. These test/train data are used to fit the learning algorithm so that it can learn how to predict. The test set we have used to obtain an idea of working the model with new data.
x_train, x_test, y_train, y_test = train_test_split(
x, y, test_size=0.2)
# the test set will be 20% of the whole data set
After that, fit the model on the training set.
linreg = LinearRegression()
linreg.fit(x_train, y_train)
Once we fit the model, then we have to print all coefficients.
print linreg.coef_
-46773.65
[282.29] # for an increase of 1 square meter in house size,
# the house price will go up by ~$282, on average
The value of Y will be equal to a0 when the value of X = 0; in this case, it will be the house’s price when the sqft_living is zero. The a1 coefficient is the change in the Y divided by changing the value in X. the increment of the one sq meter in the size of the house is associated with the price increment of 282 dollars.
Now, we can predict the 1000 Sq ft living house’s price using the following model:
price = -46773.65 + 1000*282.29
# using the model
linreg.predict(1000)
array([ 238175.93])
Once we have done with the above procedure, compute an RMSE or Root Mean Squared Error it is the most commonly used metric for evaluating the regression model on a test set:
np.sqrt(mse)
259163.48
linreg.score(x_test, y_test)
0.5543
So as you can see that, we got a root mean squared error of 259163.48 after predicting the house’s prices. We are using a single feature in the above model; the result was expected. However, you can improve the model by adding more features.
Conclusion
We hope our detailed guide about house price prediction using linear regression was helpful to you. As we have mentioned earlier, there is multiple linear regression such as simple regression and multivariable regression. Primarily we have used simple regression to predict the price of the house easily. However, you can use multivariable regression to predict the results more accurately using different variables. Apart from it, we have used a complete dataset that has accurate information regarding the houses. Majorly, all of the above codes and libraries we have used are not unique as there is a specific procedure to perform the house prediction procedure by linear regression.


