In this guide, we will discuss how to fix this error by converting the data from string to numeric type (int or float) using pandas.DataFrame.astype() and pandas.to_numeric() functions.
Reproducing the Error
First, produce this error by creating the plot.
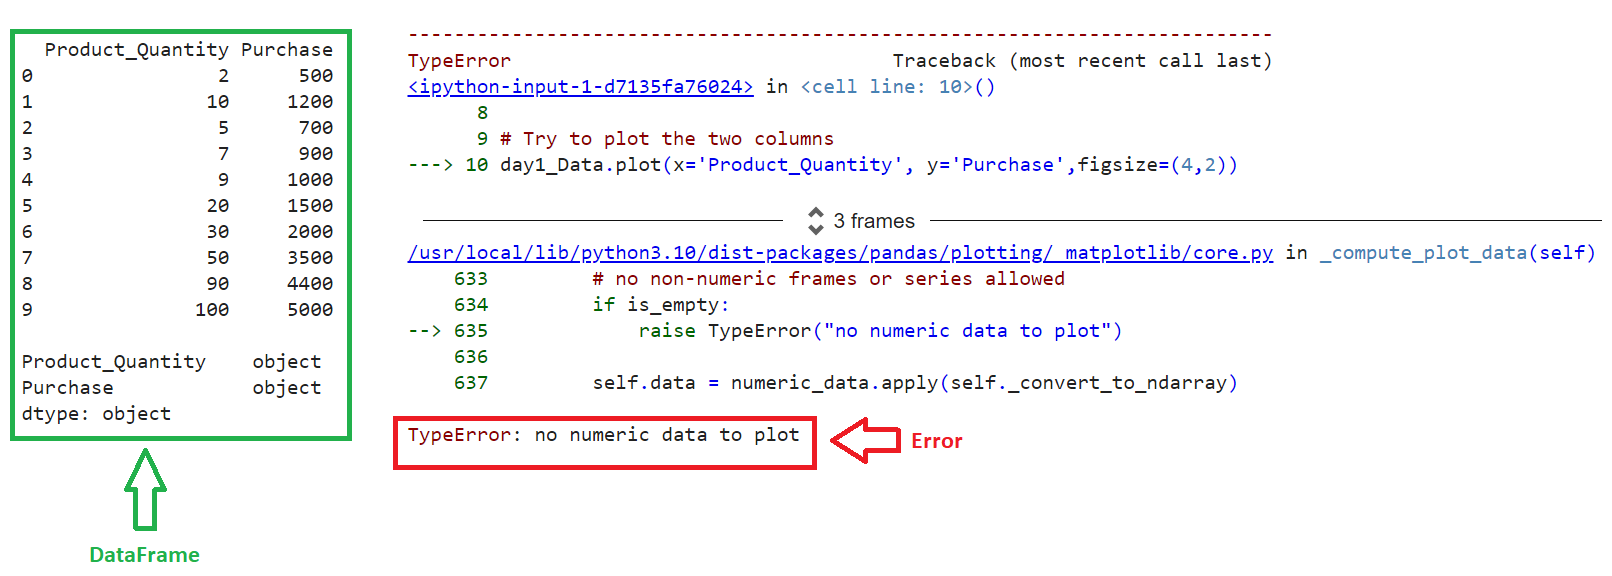
Create ‘day1_Data’ DataFrame with two columns (Product_Quantity & Purchase). Try to plot the data by passing these two columns as x and y to the pandas.DataFrame.plot() function.
# Products DataFrame
day1_Data = pandas.DataFrame({'Product_Quantity': ['2','10','5','7','9','20','30','50','90','100'],
'Purchase': ['500','1200','700','900','1000','1500','2000','3500','4400','5000']})
print(day1_Data,"\n")
print(day1_Data.dtypes)
# Try to plot the two columns
day1_Data.plot(x='Product_Quantity', y='Purchase',figsize=(4,2))
Output
You can see that an error is raised due to the datatype of the columns that we are going to plot. It should be either an int or float.
Solution 1: Change the Type Using pandas.DataFrame.astype
If we change the data type of the columns to a numeric type using the pandas.DataFrame.astype() function, DataFrame can be plotted. Basically, this function casts the pandas object (DataFrame in our scenario) to the specified data type.
Syntax
Let’s see the syntax of pandas.DataFrame.astype() function.
- dtype – This parameter takes the data type to which the DataFrame columns are coveted to this type.
- copy – we can use this parameter to return the copy by setting it to True.
- errors (Default = ‘raise’) – If invalid data type is passed as a parameter to this function, it will raise an exception. In order to suppress the exceptions, set this parameter to ‘ignore.
Example
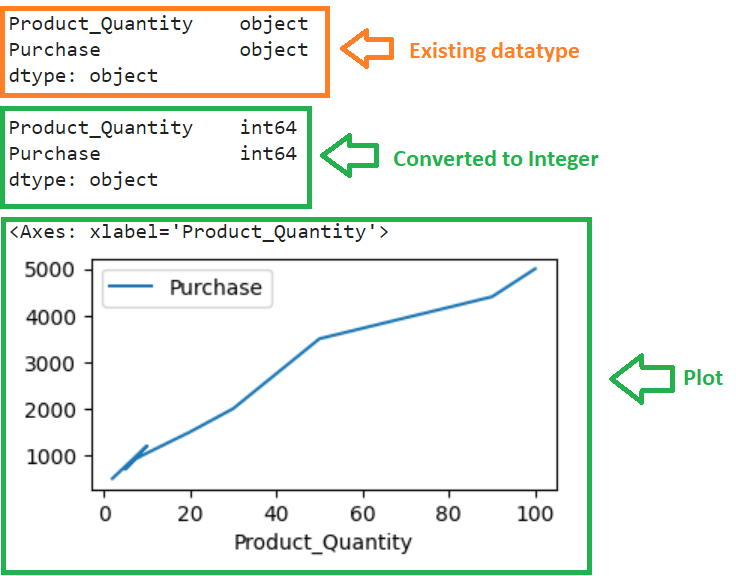
Cast the two columns in the above data into integer type by passing the dtype as ‘int’ to the pandas.DataFrame.astype() function. Then, plot the two columns.
import pandas
# Products DataFrame
day1_Data = pandas.DataFrame({'Product_Quantity': ['2','10','5','7','9','20','30','50','90','100'],
'Purchase': ['500','1200','700','900','1000','1500','2000','3500','4400','5000']})
print(day1_Data.dtypes,"\n")
# Convert both the columns to integer
day1_Data['Product_Quantity'] = day1_Data['Product_Quantity'].astype(int)
day1_Data['Purchase'] = day1_Data['Purchase'].astype(int)
print(day1_Data.dtypes,"\n")
# Plot the two columns
day1_Data.plot(x='Product_Quantity', y='Purchase',figsize=(4,2))
Output
First, we casted the data type from object to int64 and then plotted the two columns.
Solution 2: Change the Type Using pandas.to_numeric()
This function converts the provided argument to numeric type.
Syntax
Let’s see the syntax of the pandas.to_numeric() function with parameters in detail.
- arg – It refers to the input one-dimensional data to be converted into numeric type. You can pass DataFrame columns, Series, List, Tuple, Array etc.
- errors – If the arg holds string type elements, this function automatically raise a ValueError exception. You can control the flow of the code without raising the error.
- If errors = ‘raise’ (default), then invalid parsing will raise an exception.
- If errors = ‘coerce’, then invalid elements will be set as NaN.
- If errors = ‘ignore’, then invalid elements will return as existing.
- downcast – You can change the datatype of the argument while converting it to numeric.
- If downcast is ‘integer’ or ‘signed’, then the data type is casted into smallest signed int – int8
- If downcast is ‘unsigned’, then the data type is casted into smallest unsigned int – uint8
- If downcast is ‘float’, then the data type is casted into smallest float type – float32
- If downcast is ‘None’, Actual argument data type is considered.
Example
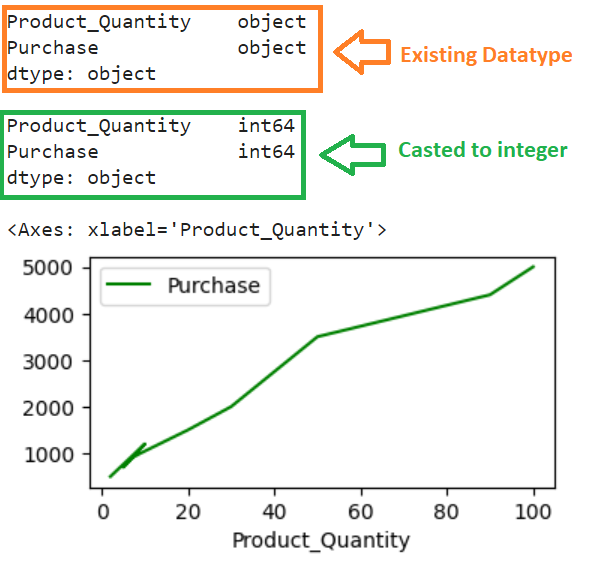
Cast the two columns in the above data into integer type by passing the dtype as ‘int’ to the pandas.to_numeric() function. Plot the two columns.
import pandas
# Products DataFrame
day1_Data = pandas.DataFrame({'Product_Quantity': ['2','10','5','7','9','20','30','50','90','100'],
'Purchase': ['500','1200','700','900','1000','1500','2000','3500','4400','5000']})
print(day1_Data.dtypes,"\n")
# Convert both the columns to integer
day1_Data['Product_Quantity'] = pandas.to_numeric(day1_Data['Product_Quantity'])
day1_Data['Purchase'] = pandas.to_numeric(day1_Data['Purchase'])
print(day1_Data.dtypes,"\n")
# Plot the two columns
day1_Data.plot(x='Product_Quantity', y='Purchase',figsize=(4,2),color='green')
Output
First, we casted the data type from object to int64, and then plotted the two columns.
Conclusion
We learned how to plot the data without getting the TypeError: no numeric data to plot by casting the datatype the column from object to integer using pandas.Dataframe.astype() and pandas.to_numeric() functions with examples. Both the functions are explained in detail with all the parameters. It’s your time to plot the data with different plots like scatter plot, bar plot, and more.


