This blog will demonstrate:
- How to Fetch Data in Streamlit From Source Code?
- How to Fetch Data in Streamlit From an External File?
How to Fetch Data in Streamlit From Source Code?
In Streamlit, data can be fetched from different sources such as databases, external files, Python scripts, or source files. Streamlit also enables us to fetch application data or results generated programmatically in different forms. In order to fetch data in Streamlit in dataframes or bar charts, follow the below-provided demonstration.
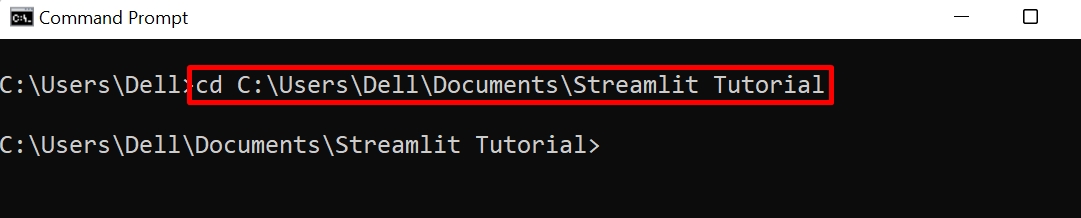
Step 1: Navigate to Project Directory
First, navigate to the project directory through the “cd <path to project-directory>” command:
Note: Working in a virtual environment is considered a good approach as it isolates Python, pip, and all other packages and libraries. In order to install and set up a virtual environment, go through our linked article “Activate Virtual Environment”.
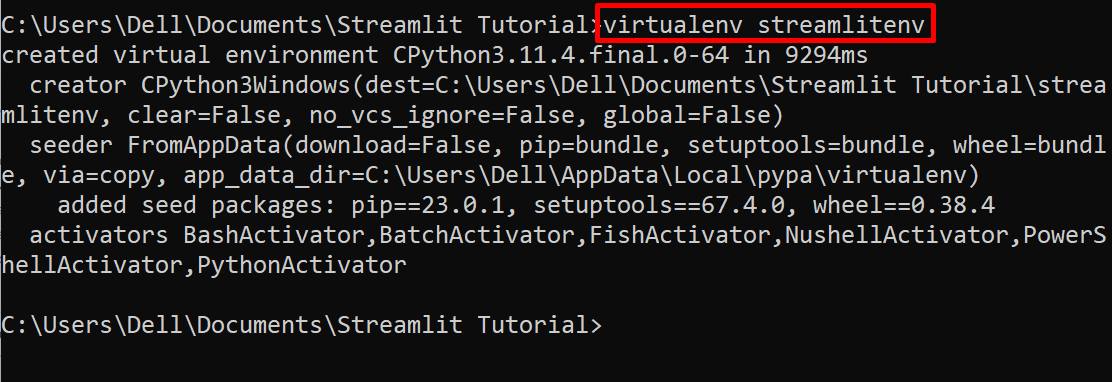
Step 2: Create and Activate Virtual Environment
To create a new virtual environment for the current project, utilize the “virtualenv <env-name>” command:
For demonstration, we have created “streamlitenv”:
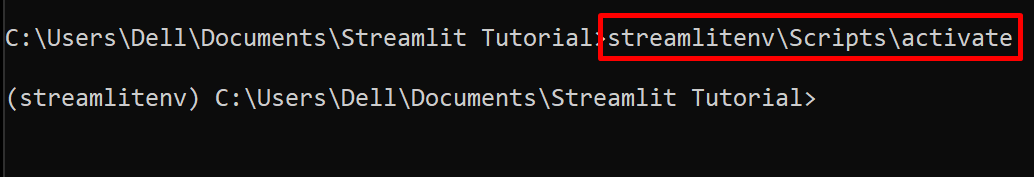
Next, activate the newly created virtual environment in the project directory using the below command:
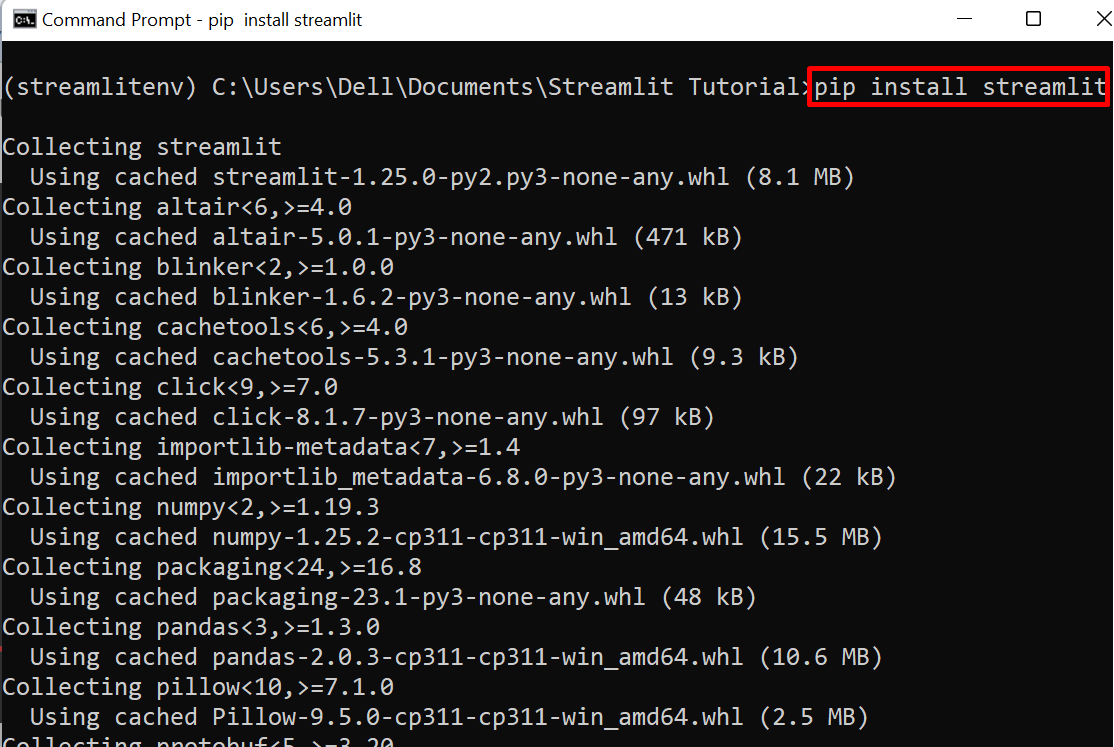
Step 3: Install Streamlit
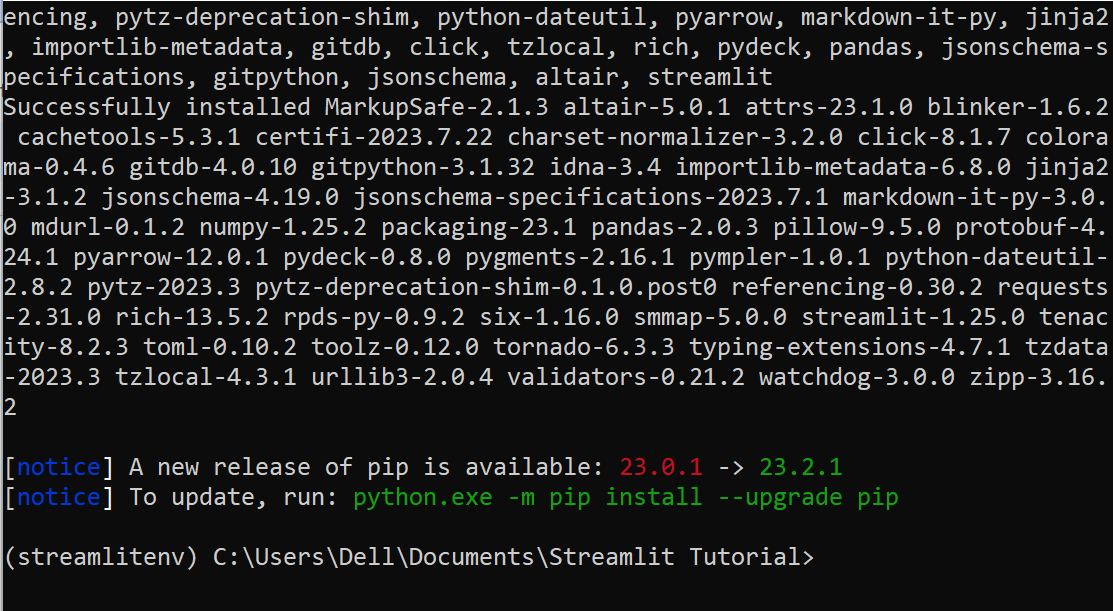
Next, install the Streamlit Python library with the help of the “pip” package manager. For this purpose, utilize the below command:
Step 4: Create Python Script
Next, create a new file named “Demo.py” and set its extension as “.py”. After that, paste the below snippet into the file:
import streamlit as st
st.title("Students Result")
@st.cache_data
def load_data():
return pd.DataFrame(
{
"Name": ["Jazzy", "Marry", "Maria", "Jenny"],
"Marks": [40, 43, 50, 45],
}
)
df = load_data()
st.dataframe(df)
st.bar_chart(df)
The description of the above code is as follows:
- First, import the required libraries such as “pandas” to create dataframes and “streamlit” to fetch and visualize the data.
- Set the title for a webpage using “st.title”.
- Define the “load_data()” method that returns the static data frame.
- In the data frame, we have set the students name and marks.
- Call the “load_data()” method and save its return value in the “df” variable.
- Now, show the data in Streamlit representable form such as “dataframe” and “bar_charts”.
Step 5: Fetch Data in Streamlit
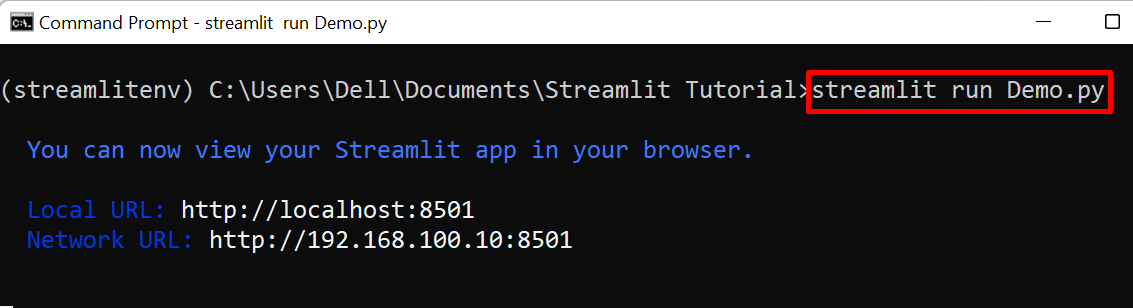
Now, run the Python script in Streamlit using the below command:
The output shows that the Python script is running on localhost port “8501”:
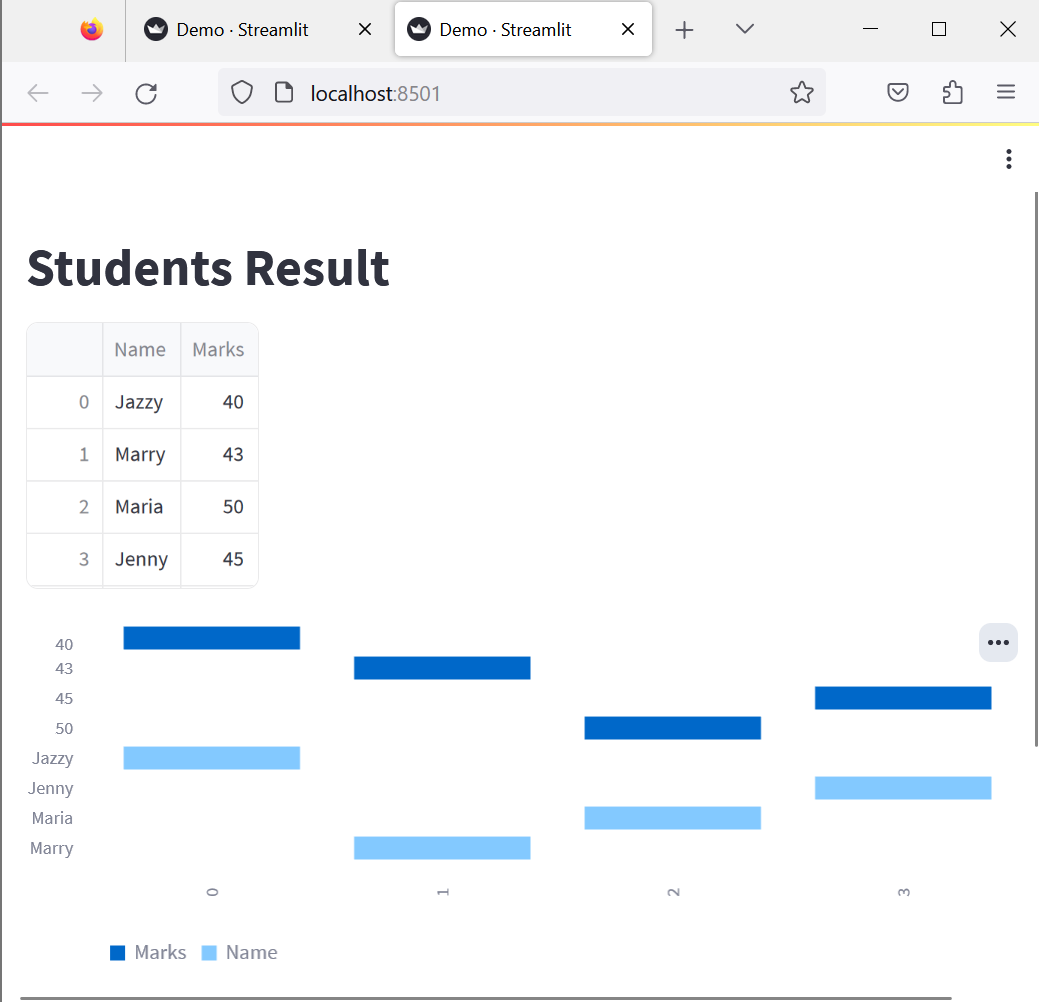
For verification, navigate to the “localhost:8501” URL in the browser and check if data is fetched in Streamlit or not. The below result shows that we have successfully fetched the data from the source code and displayed it in “dataframe” and “bar chart”:
How to Fetch Data in Streamlit From an External File?
In streamlit, users can read data from different sources. In order to read data from any external file such as a CSV file, go through the provided demonstration.
Step 1: Create a Program to Read Data From File
First, create a simple Python file with the “.py” extension. For instance, we have created “Demo1.py”. After that, paste the below snippet into the file:
import streamlit as st
st.title ("Fetch Data in Streamlit")
Cars_data = pd.read_csv(r"C:\Users\Dell\Documents\Streamlit Tutorial\Cars.csv")
st.write(Cars_data)
In the above code:
- “pandas” library will be used to read data from files and “streamlit” will show data in representative form.
- Here, “read_csv()” is used to read or fetch data from the provided path that is passed in its parentheses.
- The “write()” method is used to display data on streamlit.
Step 2: Run the Python Script
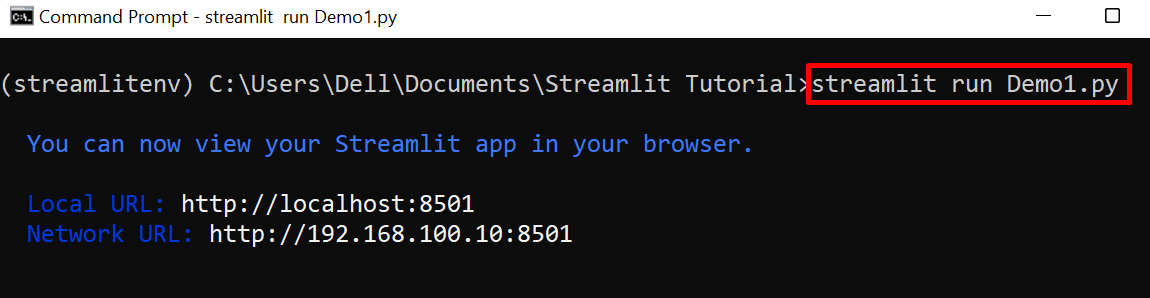
Now, run the program file with streamlit through the mentioned command:
Here, the output shows that the program is executing on localhost port “8501”:
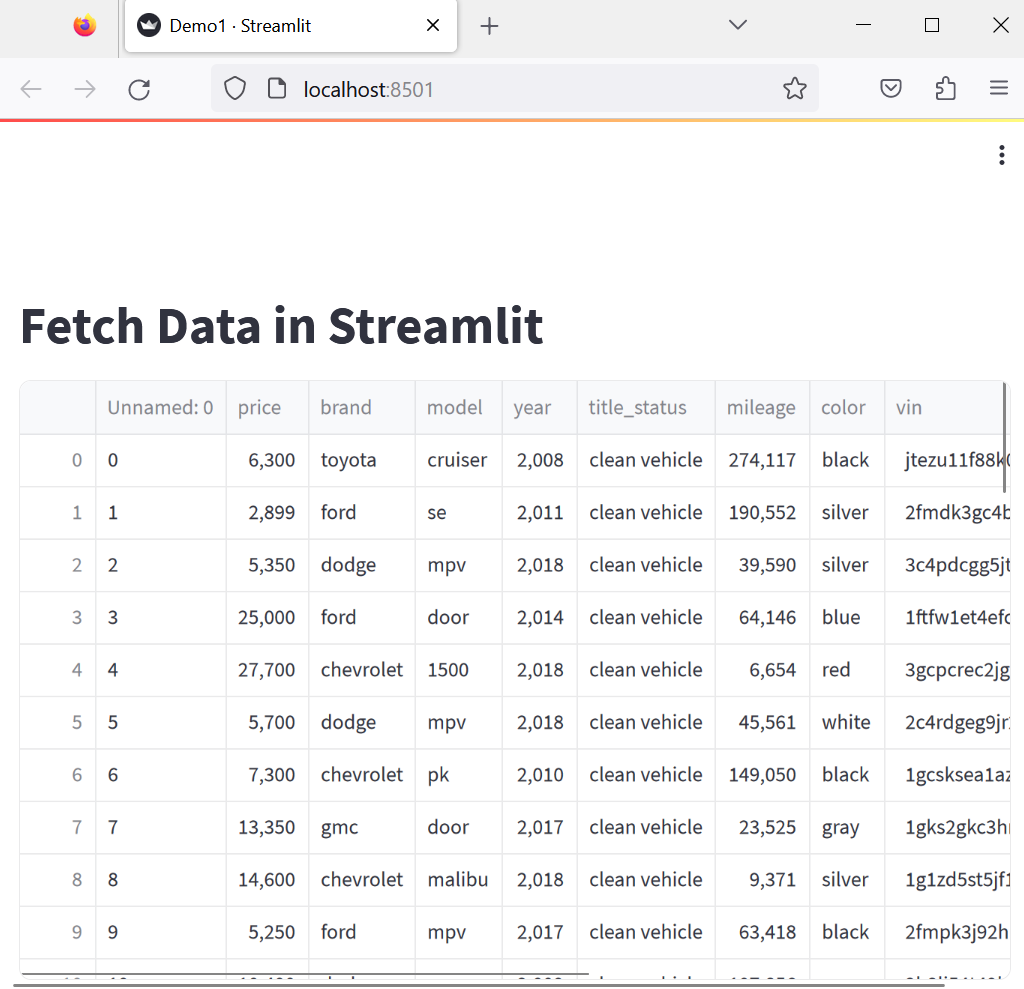
Open the browser, navigate to the “localhost:8501” URL, and check if data is fetched from a file in Streamlit or not. The output shows that we have successfully fetched the data from the CSV file in Streamlit:
That is all about fetching data in Streamlit.
Conclusion
To fetch data in Streamlit, first install the Streamlit library. After that, import the pandas and streamlit library. Utilize the “pandas” python’s library to read, clean, or fetch the data. Then, utilize the streamlit components such as dataframes, bar_charts, and histograms to display data. After that, run the Python script using the “streamlit run <filename.py>” command. We have illustrated how to fetch data in streamlit.