Matplotlib allows us to create a wide variety of static, animated, and interactive visualizations in Python. In addition, it is often used with other scientific libraries like SciPy and Pandas to visualize data.
When working in Matplotlinb, you may need to add additional information to your plots, including Greek letters. This tutorial will show how to add Greek letters to a matplotlib plot.
Using Raw Strings
A raw string refers to a string literal that is prefixed with the letter ‘r’ or ‘R’. Raw strings are mainly used to create strings containing backslashes or special characters, otherwise treated as escape characters.
Matplotlib provides an expression parser and layout engine to interpret raw strings.
We can use this to display special characters, such as Greek letters, by appending the string with the letter ‘r’/
An example is shown below:
import matplotlib.pyplot as plt
import matplotlib.pyplot as plt
x = np.linspace(0, 10, 100)
y = np.sin(x)
fig, ax = plt.subplots()
ax.plot(x, y)
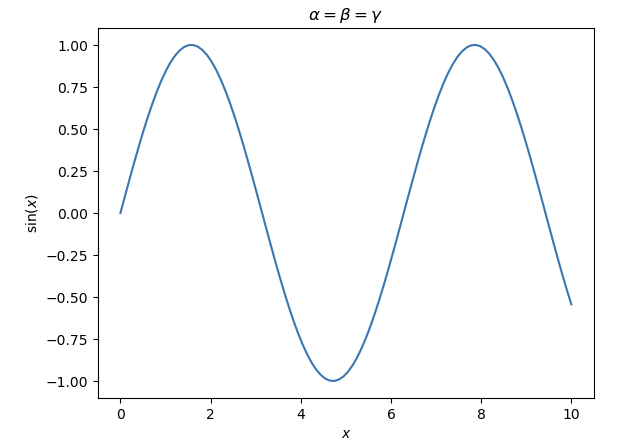
ax.set_xlabel(r'$x$')
ax.set_ylabel(r'$\sin(x)$')
ax.set_title(r'$\alpha = \beta = \gamma$')
plt.show()
The example code above will generate a simple sine curve plot with the x-axis labeled with x and the y-axis marked with sin(x). The title will be α = β = γ .
By using the r prefix to indicate a raw string, we can include Greek letters in the labels and title without escaping the backslashes that would typically be required to represent them in regular strings.
The resulting figure is as shown:
Using the chr() Function
The chr() function is a built-in function that takes an integer as an argument and returns a string containing a single character corresponding to the specified Unicode code point. The code point is an integer between 0 and 1,114,111 (0x10FFFF in base 16).
It is the opposite of ord() function. The ord() function returns the code point of the passed Unicode character. It is used to get the ASCII/Unicode value of any character.
To use the function to show Greek letters, we can do:
import numpy as np
x = np.linspace(0, 10, 100)
y = np.sin(x)
fig, ax = plt.subplots()
ax.plot(x, y)
ax.set_xlabel("x")
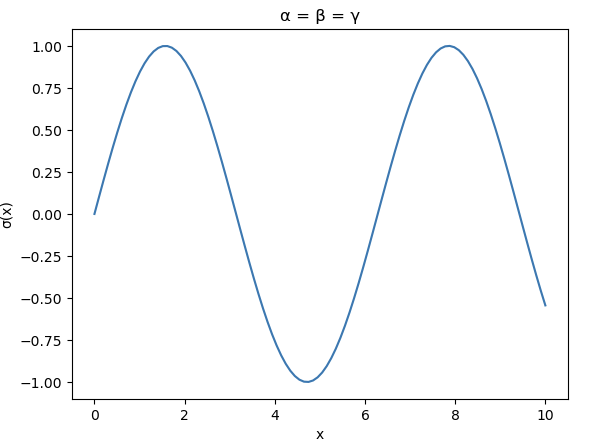
ax.set_ylabel(chr(963) + "(x)")
ax.set_title(chr(945) + " = " + chr(946) + " = " + chr(947))
plt.show()
In this example, chr(963) matches the code point for the Greek letter “sigma” used in the y-label as sin(x), the chr(945), chr(946), and chr(947) refers to the code point for the Greek letters “alpha,” “beta” and “gamma” respectively, used in the title as α = β = γ .
It is important to note that the code points for Unicode characters will depend on the encoding used. In this example, we are using UTF-8 character encoding.
Conclusion
You discovered how you can use Python raw strings and the chr() function to display Greek characters in a Matplotlib plot.