It leverages the cutting-edge indexing and search techniques to efficiently store, retrieve, and process a vast amount of multi-dimensional data, particularly the vectors. Milvus supports similarity search, similarity join, and other advanced operations that enable the users to handle the complex data analysis tasks effectively.
Milvus provides a comprehensive set of APIs and SDKs in multiple programming languages which allows us to integrate it seamlessly into AI workflows.
It also has various data types including integers, floating-point numbers, and binary vectors which ensure the versatility in accommodating a diverse application scenarios.
Grafana, on the other hand, is a sophisticated and feature-rich open-source data visualization and analytics platform that is designed to facilitate a real-time monitoring, analysis, and exploration of complex time-series data.
This tutorial will teach you how to use Grafana to create alerts. This allows you to receive notifications when the value of a specific metric exceeds a defined threshold.
Requirements:
This tutorial assumes that you have the following:
- Installed Kubernetes Engine
- A Milvus cluster that is deployed on Kubernetes
Deploying Grafana and Prometheus
To get the metrics from the Milvus cluster, we need Prometheus which can interact with the Kubernetes pods and gather the metric information. Grafana allows us to visualize the metrics from Prometheus, create data visualization, and create alerts.
If you wish to learn how Prometheus interacts with the Milvus cluster and how it gathers the metrics, you can check the following link:
https://milvus.io/docs/monitor.md
To save us the trouble of manually using Prometheus and Grafana, Milvus uses the kube-Prometheus which provides us with the manifest to deploy Prometheus and Grafana quickly.
https://github.com/prometheus-operator/kube-prometheus
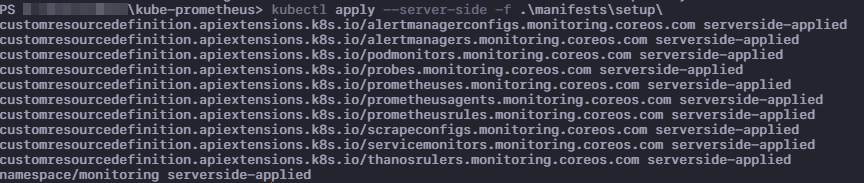
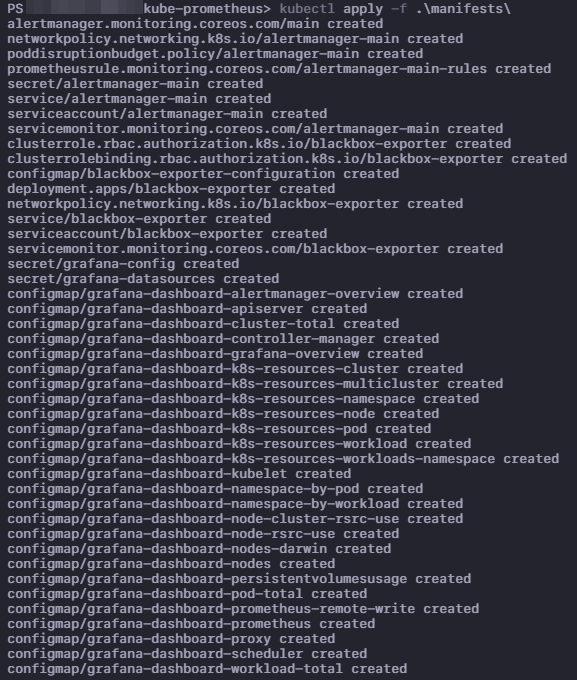
You can run the commands as provided in the following to quickly deploy it:
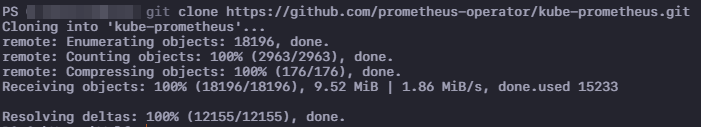
Run the manifest:
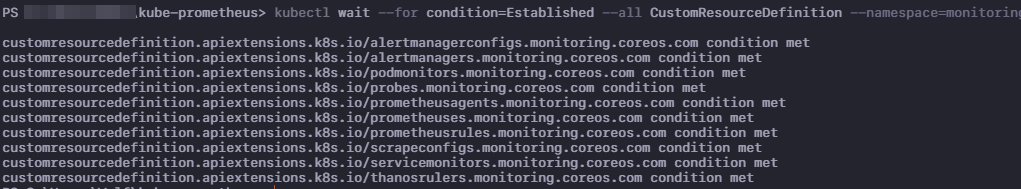
--for condition=Established \
--all CustomResourceDefinition \
--namespace=monitoring
Once everything is setup, you can access the dashboards for both Grafana and Prometheus using the commands:
For Prometheus:
For Grafana:
You can then enable the monitoring on your Milvus cluster:
Once completed, check the service monitor.
Creating Alerts
To add an alert for the memory usage of Milvus components, edit the Memory panel in Grafana and add a new query with the metric:
Save the dashboard and wait a few minutes to see the alert.
Conclusion
This explores the basics of setting up the notifications for various resources in the Milvus cluster using Prometheus and Grafana. Check the docs for more info.