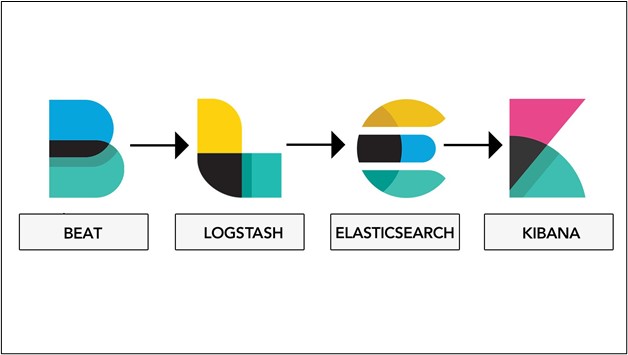
This post will demonstrate what is Elastic Stack and how to configure it.
What is Elastic Stack?
The Elastic Stack is one step higher than the ELK stack. It includes all ELK stack components Elasticsearch, Kibana, and Logstash. Additionally, it introduces the lightweight Beats family to make Elasticsearch more stable, flexible, lightweight, and simpler. With the launch of Beats in the ELK stack, the name of the ELK stack changes to the Elastic stack. To configure the Elastic stack, users need to set up and configure all its modules or components:
How to Configure Elastic Stack on Windows?
The Elastic stack is a collection of different projects that are Elasticsearch, Kibana, Logstash, and Beats. Users need to install all these tools to complete the Elastic stack configuration. To completely configure the Elastic stack, go through the following steps:
- Configure and Setup Elasticsearch
- Configure and Setup Logstash
- Configure and Setup Kibana
- Configure and Setup Beats
Step 1: Configure and Setup Elasticsearch
Elasticsearch is a major component of the Elastic stack. It is a distributed, open-source, free analytical database and search engine. It is utilized to store, manage and analyze various types of data such as numerical data, textual data, geospatial data, nonstructural and semi-structured data, or raw data. It is purely a NoSQL database that works with Rest APIs and Query DSL to manage and store data in a document in JSON format.
In order to setup Elasticsearch on Windows, go through our step-by-step guide on “Install Elasticsearch With .Zip File on Windows”
Step 2: Configure and Setup Logstash
Logstash is one of the other core parts of Elastic stack that is usually used as a log analytical tool. It works with Elasticsearch to manage and analyze logs. It is also considered a server-side pipeline that collects data from different sources and classifies it into classes. Then, send the data to Elastic Stash.
To configure and install Logstash with Elasticsearch, follow up on our linked article “What is Logstash and How to Configure it With Elasticsearch”.
Step 3: Configure and Setup Kibana
Kibana is Elasticsearch’s visualization tool that is utilized to represent the data in a graphical representation or in visual form. It uses different components to represent and analyze the Elasticsearch data such as Pie charts, heap maps, line graphs, and histograms.
To install and set up the Kibana tool for Elasticsearch, follow our provided guide “How to Setup Kibana For Elasticsearch”
Step 4: Configure and Setup Beats
The Beats make the Elastic stack different from the ELK stack. It is a combination of different lightweight tools that includes Filebeat, Metricbeat, Packetbeat, Winlogbeat, Auditbeat, and Heartbeat. All these members of the Beats family are used for specific purposes and users can use them according to their requirements. Their setups are easily available on the official Elasticsearch website.
For a demonstration to install Beats on Windows, follow our linked article “Setup Filebeat on Windows – Elasticsearch”.
That is all about the configuration of Elastic Stack on Windows.
Conclusion
To configure Elastic stack on Windows, users are required to install all the components that make it stack such as Elasticsearch, Kibana, Logstash, and Beats. In this writeup, we have briefly defined each Elastic stack component and also provide the associated articles to set up and configure them. We have demonstrated the step-by-step process to set up and configure the Elastic stack on Windows.

