Existing tools
Many tools for network analysis have existed for quite some time. Under Linux, for example, these are Wireshark, tcpdump, nload, iftop, iptraf, nethogs, bmon, tcptrack as well as speedometer and ettercap. For a detailed description of them, you may have a look at Silver Moon’s comparison [1].
So, why not use an existing tool, and write your own one, instead? Reasons I see are a better understanding of TCP/IP network protocols, learning how to code properly, or implementing just the specific feature you need for your use case because the existing tools do not give you what you actually need. Furthermore, speed and load improvements to your application/system can also play a role that motivates you to move more in this direction.
In the wild, there exist quite several Python libraries for network processing and analysis. For low-level programming, the socket library [2] is the key. High-level protocol-based libraries are httplib, ftplib, imaplib, and smtplib. In order to monitor network ports and the packet stream competitive candidates, are python-nmap [3], dpkt [4], and PyShark [5] are used. For both monitoring and changing the packet stream, the scapy library [6] is widely in use.
In this article, we will have a look at the PyShark library and monitor which packages arrive at a specific network interface. As you will see below, working with PyShark is straightforward. The documentation on the project website will help you for the first steps — with it, you will achieve a usable result very quickly. However, when it comes to the nitty-gritty, more knowledge is necessary.
PyShark can do a lot more than it seems at first sight, and unfortunately, at the time of this writing, the existing documentation does not cover that in full. This makes it unnecessarily difficult and provides a good reason to look deeper under the bonnet.
About PyShark
PyShark [8] is a Python wrapper for Tshark [10]. It simply uses its ability to export XML data using its parsing. Tshark itself is the command-line version of Wireshark. Both Tshark and PyShark depend on the Pcap library that actually captures network packages and is maintained under the hood of Tcpdump [7]. PyShark is developed and continuously maintained by Dan (he uses the name KimiNewt on Twitter).
In order to prevent possible confusion, there exists a similar-sounding tool, Apache Spark [11], which is a unified analytics engine for large-scale data processing. The name PySpark is used for the Python interface to Apache Spark, which we do not discuss here.
Installing PyShark
PyShark requires both the Pcap library and Tshark to be installed. The corresponding packages for Debian GNU/Linux 10 and Ubuntu are named libpcap0.8 and tshark and can be set up as follows using apt-get:
Listing 1: Installing the Pcap library and Tshark
If not installed yet, Python3 and Pip have to be added too. The corresponding packages for Debian GNU/Linux 10 and Ubuntu are named python3 and python3-pip and can be installed as follows using apt-get:
Listing 2: Install Python 3 and PIP for Python 3
Now it is time to add PyShark. Based on our research PyShark is not packaged for any major Linux distribution yet. The installation of it is done using the Python package installer pip3 (pip for Python 3) as a system-wide package as follows:
Listing 3: Install PyShark using PIP
Now, PyShark is ready to be used in Python scripts on your Linux system. Please note to execute the Python scripts below as an administrative user, for example, using sudo because the Pcap library does not permit you to look for packages as a regular user.
The following statement adds the content of the PyShark module to the namespace of your Python script:
Listing 4: Import the PyShark module
Methods of Capturing Packages
Out of the box, PyShark comes with two different modes with which it offers to collect packets from the observed network interface. For continuous collection, use the LiveCapture() method, and for saving to a local file, use the FileCapture() method from the PyShark module. The result is a package list (Python iterator object) that allows you to go through the captured data package by package. The listings below demonstrate how to use the two methods.
Listing 5: Use PyShark to capture from the first Wifi interface wlan0
capture = pyshark.LiveCapture(interface='wlan0')
With the previous statements, the captured network packages are kept in memory. The available memory might be limited, however, storing the captured packages in a local file is an alternative. In use is the Pcap file format [9]. This allows you to process and interpret the captured data by other tools that are linked to the Pcap library too.
Listing 6: Use PyShark to store the captured packages in a local file
capture = pyshark.FileCapture('/tmp/networkpackages.cap')
Running listings 5 and 6, you will not have any output yet. The next step is to narrow down the packages to be collected more precisely based on your desired criteria.
Selecting Packets
The previously introduced capture object establishes a connection to the desired interface. Next, the two methods sniff() and sniff_continuously() of the capture object collect the network packets. sniff() returns to the caller as soon as all the requested packets have been collected. In contrast, sniff_continuously() delivers a single packet to the caller as soon as it was collected. This allows a live stream of the network traffic.
Furthermore, the two methods allow you to specify various limitations and filtering mechanism of packages, for example, the number of packages using the parameter packet_count, and the period during which the packages are to be collected using the parameter timeout. Listing 7 demonstrates how to collect 50 network packages, only, as a live stream, using the method sniff_continuously().
Listing 7: Collect 50 network packages from wlan0
capture = pyshark.LiveCapture(interface='wlan0')
for packet in capture.sniff_continuously(packet_count=5):
print(packet)
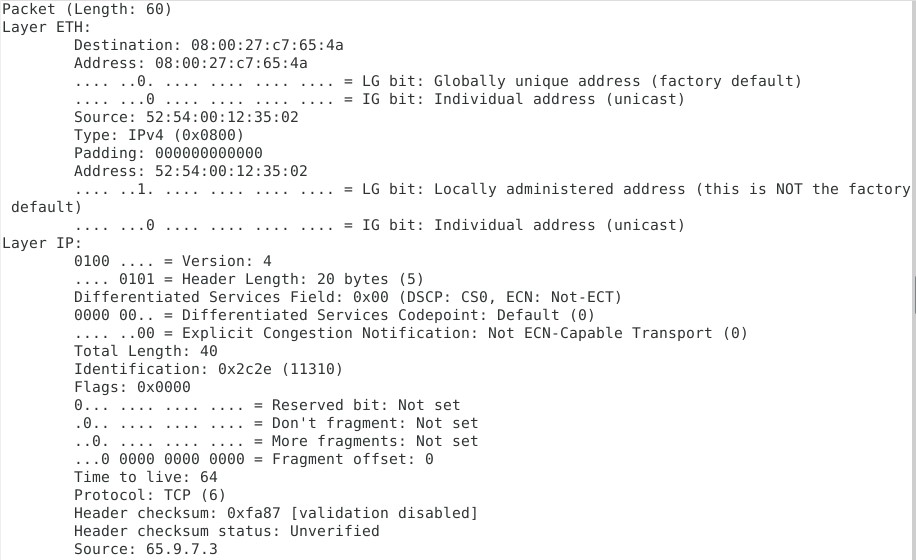
Various packet details are visible using the statement print(packet) (see Figure 1).
Figure 1: package content
In listing 7, you collected all kinds of network packets no matter what protocol or service port. PyShark allows you to do advanced filtering, using the so-called BPF filter [12]. Listing 8 demonstrates how to collect 5 TCP packages coming in via port 80 and printing the packet type. The information is stored in the packet attribute highest_layer.
Listing 8: Collecting TCP packages, only
capture = pyshark.LiveCapture(interface='wlan0', bpf_filter='tcp port 80')
capture.sniff(packet_count=5)
print(capture)
for packet in capture:
print(packet.highest_layer)
Save listing 8, as the file tcp-sniff.py, and run the Python script. The output is as follows:
Listing 9: The output of Listing 8
<LiveCapture (5 packets)>
TCP
TCP
TCP
OCSP
TCP
#
Unboxing the captured packets
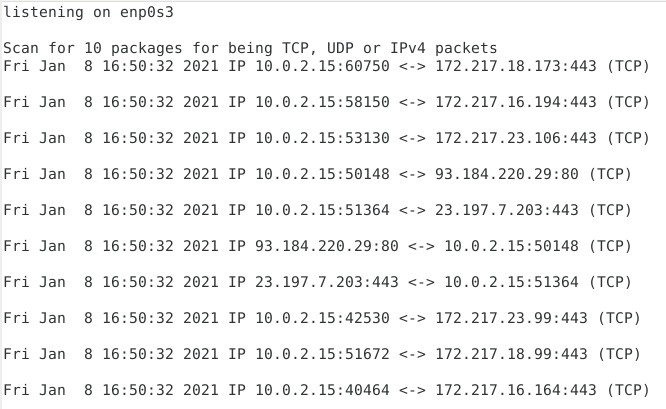
The captured object works as a Russian Matroska doll — layer by layer, it contains the content of the corresponding network packet. Unboxing feels a bit like Christmas — you never know what information you find inside until you opened it. Listing 10 demonstrates capturing 10 network packets and revealing its protocol type, both the source and destination port and address.
Listing 10: Showing source and destination of the captured packet
import time
# define interface
networkInterface = "enp0s3"
# define capture object
capture = pyshark.LiveCapture(interface=networkInterface)
print("listening on %s" % networkInterface)
for packet in capture.sniff_continuously(packet_count=10):
# adjusted output
try:
# get timestamp
localtime = time.asctime(time.localtime(time.time()))
# get packet content
protocol = packet.transport_layer # protocol type
src_addr = packet.ip.src # source address
src_port = packet[protocol].srcport # source port
dst_addr = packet.ip.dst # destination address
dst_port = packet[protocol].dstport # destination port
# output packet info
print ("%s IP %s:%s <-> %s:%s (%s)" % (localtime, src_addr, src_port, dst_addr, dst_port, protocol))
except AttributeError as e:
# ignore packets other than TCP, UDP and IPv4
pass
print (" ")
The script generates an output, as shown in Figure 2, a single line per received packet. Each line starts with a timestamp, followed by the source IP address and port, then the destination IP address and port, and, finally, the type of network protocol.
Figure 2: Source and destination for captured packages
Conclusion
Building your own network scanner has never been easier than that. Based on the foundations of Wireshark, PyShark offers you a comprehensive and stable framework to monitor the network interfaces of your system in the way you require it.
Links and References
- [1] Silver Moon: 18 Commands to Monitor Network Bandwidth on Linux server, https://www.binarytides.com/linux-commands-monitor-network/
- [2] Python socket library, https://docs.python.org/3/library/socket.html
- [3] python-nmap, https://pypi.org/project/python3-nmap/
- [4] dpkt, https://pypi.org/project/dpkt/
- [5] PyShark, https://pypi.org/project/pyshark/
- [6] scapy, https://pypi.org/project/scapy/
- [7] Tcpdump and libpcap, http://www.tcpdump.org/
- [8] PyShark, project website, http://kiminewt.github.io/pyshark/
- [9] Libpcap File Format, Wireshark Wiki, https://gitlab.com/wireshark/wireshark/-/wikis/Development/LibpcapFileFormat
- [10] Tshark, https://www.wireshark.org/docs/man-pages/tshark.html
- [11] Apache Spark, https://spark.apache.org/
- [12] BPF filter, https://wiki.wireshark.org/CaptureFilters


