Even if you are not a programmer, you can relate to the importance of optimised coding. Suppose you are running software, and it takes a lot of time to load. It gets very laggy and slow after a while. These problems can occur due to a few different reasons, but almost 90% of the time, the reason behind this is that the software code is not optimised, thus using a lot of your system’s resources resulting in a laggy experience.
In programming, there are a lot of ways to solve the required problem, the art of programming is to know which method will be the most efficient, when to use what algorithm to minimise the time and memory required to run the program.
PyCharm Memory Profiler
Optimising a code may have been a very time taking and difficult task, but not anymore. Wouldn’t it be cool if your IDE (Integrated Development Environment) had an option from where you could see how much memory does every single part of your code requires? Well, PyCharm has precisely the thing you need. Behold PyCharm’s memory profiler. You can optimise your python scripts as well as Node.js applications in PyCharm.
Plugins
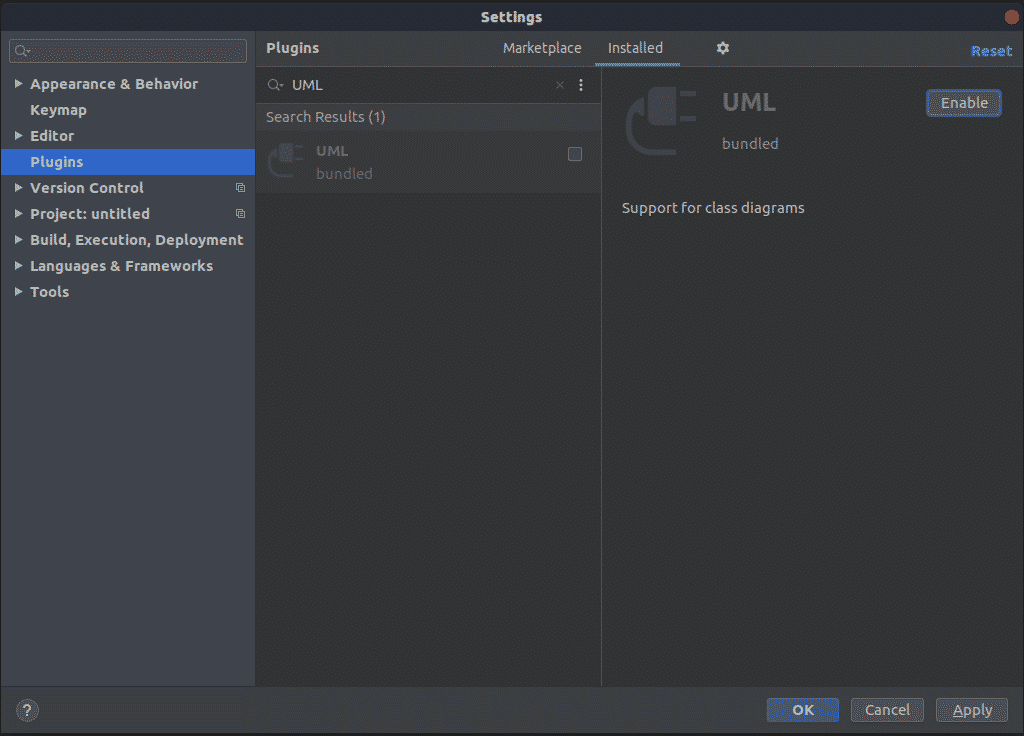
Before we start, make sure all the required plugins are installed and enabled. Make sure that UML and NodeJS plugins are installed and running for profiling Python and Node.js applications, respectively. To install the said plugins, follow the instructions given below.
Open PyCharm and go to settings by pressing Ctrl+Alt+S
Go to plugins and type NodeJS and click install.
Now switch tabs from Marketplace to Installed and in the search bar type “UML.” Click enable. Click Apply. Then click the restart now button.
Profilers
PyCharm allows you to use V8’s sample-based profiler for both CPU and memory profiling of NodeJS files. For python, it uses yappi if installed; otherwise, it uses the standard cProfile. For memory profiling, you can use a memory profiler for Python.
Python Profiling:
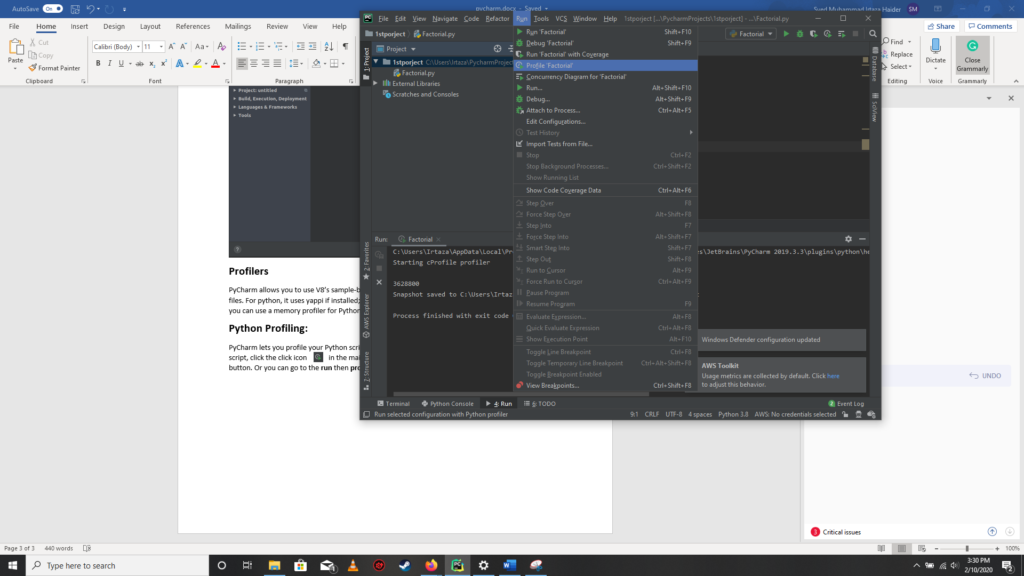
PyCharm lets you effortlessly profile your Python script. After you have finished coding your script, click the click icon in the main toolbar located on the top right corner under the minimise button. Or you can go to the run then profile <name of your script>.
Here PyCharm saves the result of your profile to a .pstat file and displays it in the new tab, named <your project name>.pstat.
Back to Source Code:
You can go back to source code by right-clicking a function name and then clicking Navigate to Source Code in the sub-tab named Statistic. Doing so will take you back to the source code of that particular function.
Graphical view:
Similarly, you can view your code in graphical form in the Call Graph tab.
V8-Memory Profiling:
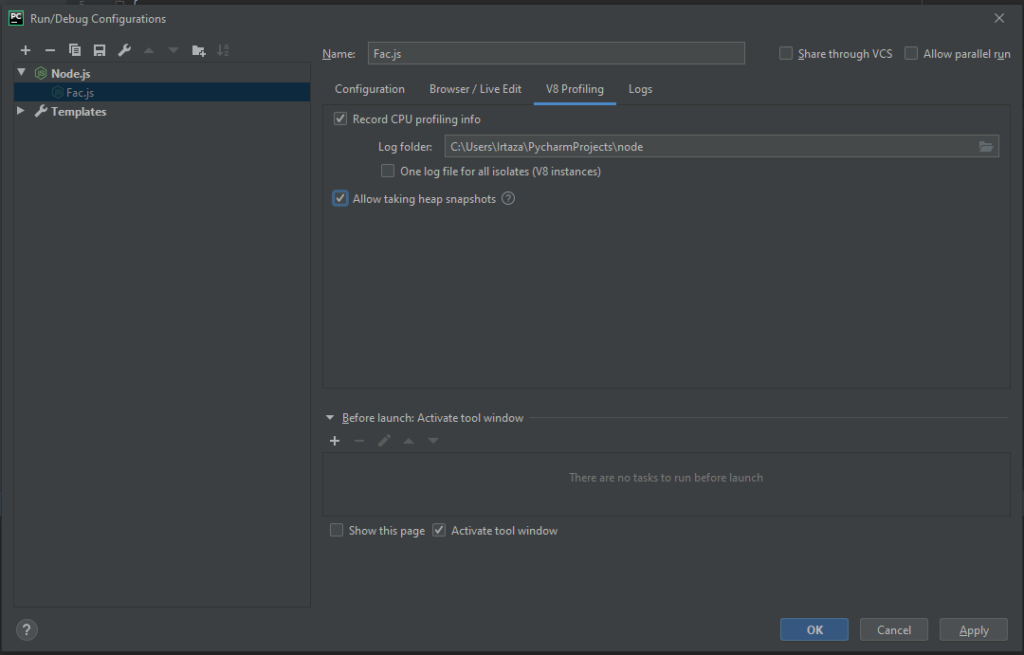
For profiling Web, you need to enable to V8 profiling. For this, go to Run/Debug Configurations. Switch to the V8 Profiling tab. Check both Record CPU profiling info and Allow taking heap snapshots checkbox. In the Record log, you can specify the folder where all your profiling log data should be kept.
Click Apply then OK.
Run your code. And during execution, click on the run-tool tab.
Specify the name and location for the snapshot and select Open Snapshot if you want to start evaluating the snapshot taken instantly.
To evaluate heapshots taken at a different time, go to tools then v8 profiling then Analyze V8 Heap Snapshots. Browse to the heapshot file you wanted to analyse. A separate tab is created with its name the same as the name of the heapshot selected. Containment tab shows your application objects grouped under Garbage Collector Roots, browser objects and DOM Windows objects. Biggest Object shows you the object that is consuming the most memory. Memory leaks due to storing data in global objects can be diagnosed here. The Summary tab, as the name suggests, shows the overall summary of the analysis. It gives an overview of objects in your application. Here the total number of objects of each type is shown along with the information about their sizes and the memory they consume(in percentage).
To differentiate between objects and moves without any context loss. Set the label to any object by selecting it and click the tick icon on the top right corner. Specify the label in the Dialog box that pops up.
Source Code:
To see the source code of a particular object, select that object and click on the pencil icon in the toolbar. Or select Edit Source. In case the options in the menu are greyed out, means no function was found corresponding to the selected object. In case multiple functions are found, these are shown in the form of a suggestion list.
Searching Snapshots:
You can perform searches on snapshots by clicking the search icon in the Containment tab. Different scopes can be specified for searching. For .e.g. if the Everywhere checkbox is ticked it will search in all the scopes. Class Names searches among the functions-constructor. Text Strings searches in the text of the functions defined. Marks checkbox is ticked when you want to search among your labels whom you set to objects by clicking the tick icon in the container tab. In short, PyCHarm gives you a lot of options o navigate through the heapshots.
Conclusion:
Pycharm has a lot of different features that most beginner programmers aren’t aware of, and these features can help you code a lot better. And this isn’t the case for only PyCharm. Almost every IDE provides some convenient features that aren’t utilised by a large proportion of consumers. So we should look for these small features that can have a significant impact on our coding and in a positive way.


