Elasticsearch is a search engine, analytics database, and big data solution to manage and operate data in real time. Elasticsearch has many use cases and multiple activities are happening while using the Elasticsearch engine. Logs are the files that are stored for each activity occurring while using Elasticsearch for multiple uses.
This guide will explain the process of viewing the Elasticsearch logs from Kibana UI.
Prerequisite: Configure Kibana With Elasticsearch
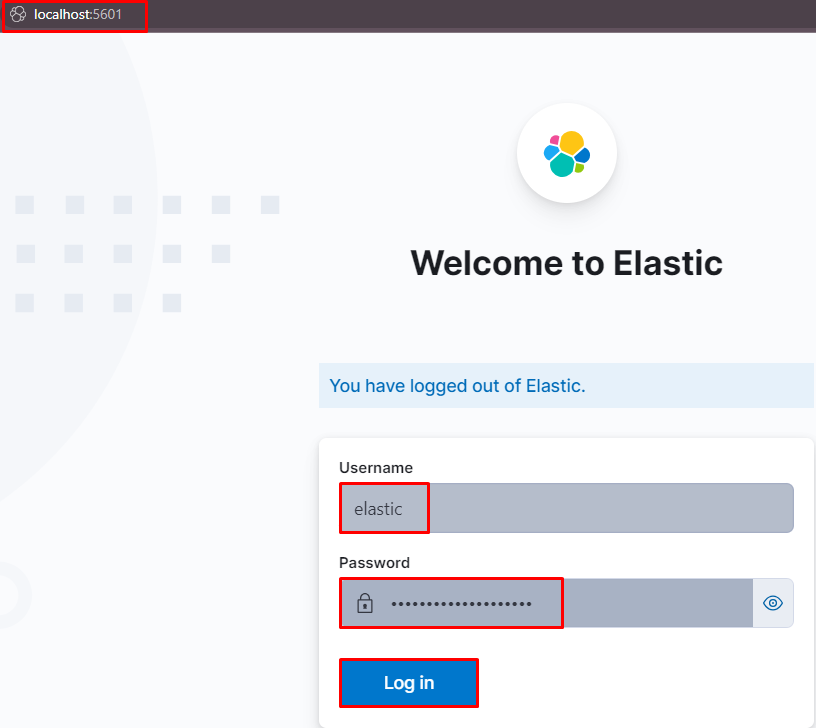
Before heading into the process of viewing the Elasticsearch logs from Kibana, it is required to perform a few tasks before. The user needs to Sign in to Elasticsearch using the credentials provided at the time of its setup and then connect to it using the localhost. After that, Kibana should be configured and then the user will log in to it to start the process.
How Do I View Elasticsearch Logs From Kibana?
To view the logs in the Elasticsearch engine, simply login to the Elasticsearch Kibana using the following address on the web browser:
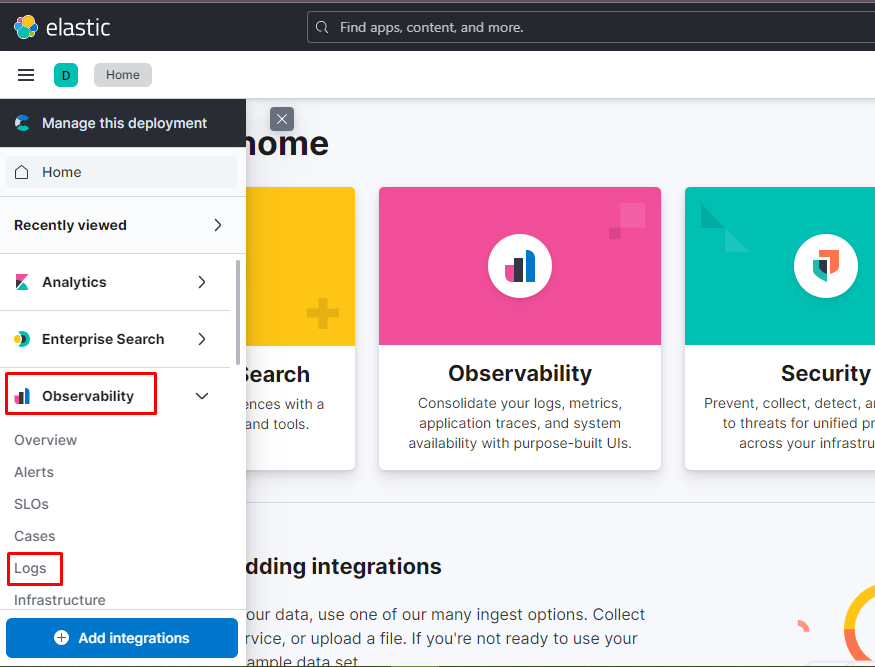
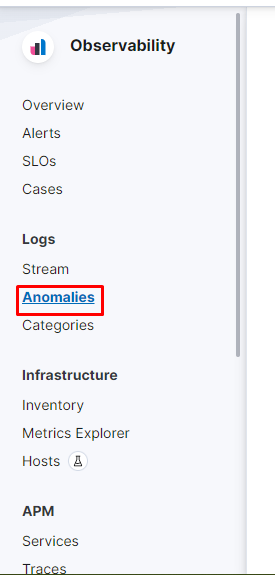
Once the user is logged in to the Kibana, simply expand the “Observability” menu and click on the “Logs” option from the left panel:
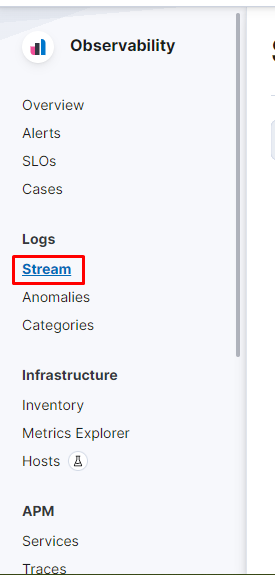
The Elasticsearch logs are divided into three sections to find exactly what the user is looking for and they are as follows:
Stream
Logs streams are used to get the live streams of the activities happening on Elasticsearch. It can be viewed by simply clicking on it from the left panel as in the following screenshot:
On the “Stream” page, click on the “Stream live” button to start getting the live streams and the user can always stop these streams at any point:
Anomalies
The next part is the “Anomalies” in the “Logs” section and to set up its detection service. For this, simply click on the “Anomalies” button from the left panel:
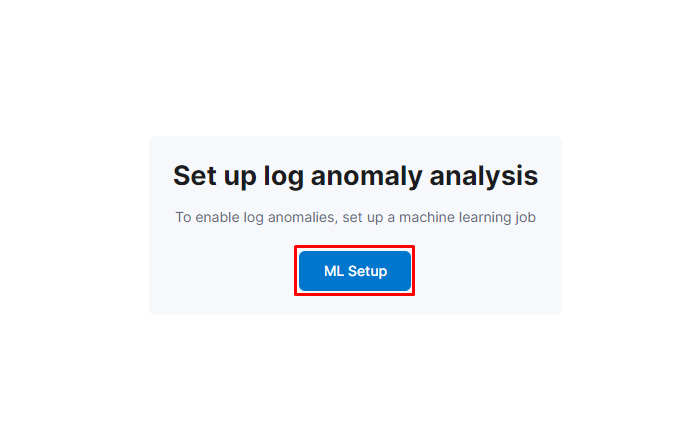
To configure the log anomalies, simply click on the “ML Setup” button:
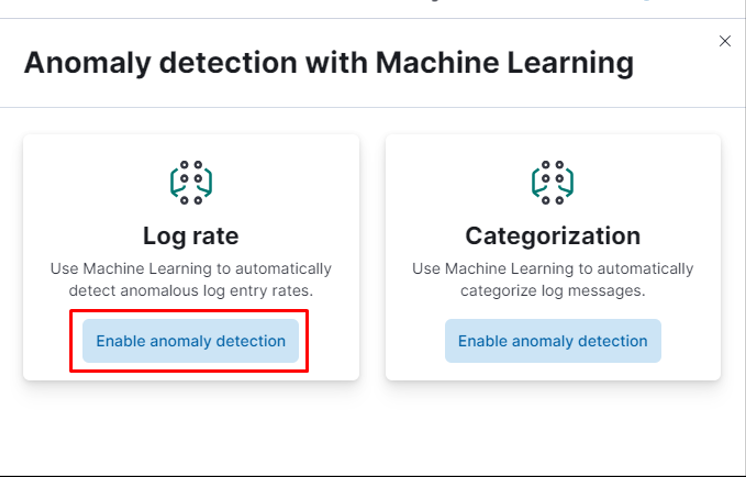
After that, click on the “Enable anomaly detection” button from the Log rate section:
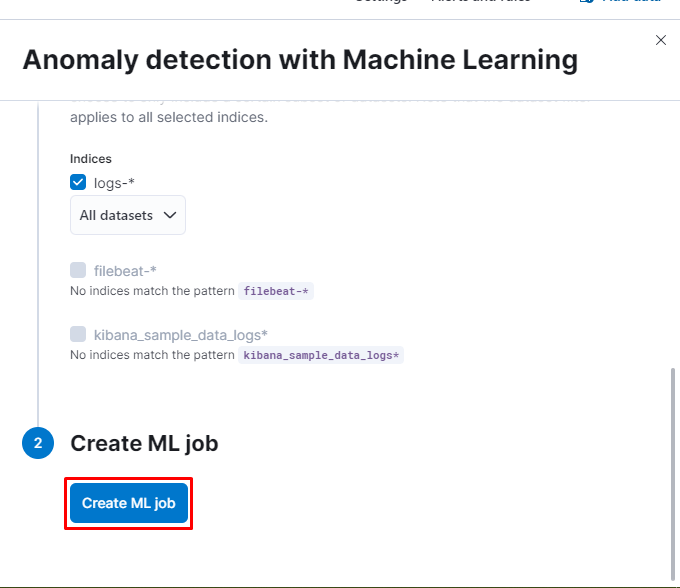
Configure the anomaly detection by selecting the log files and clicking on the “Create ML job” button:
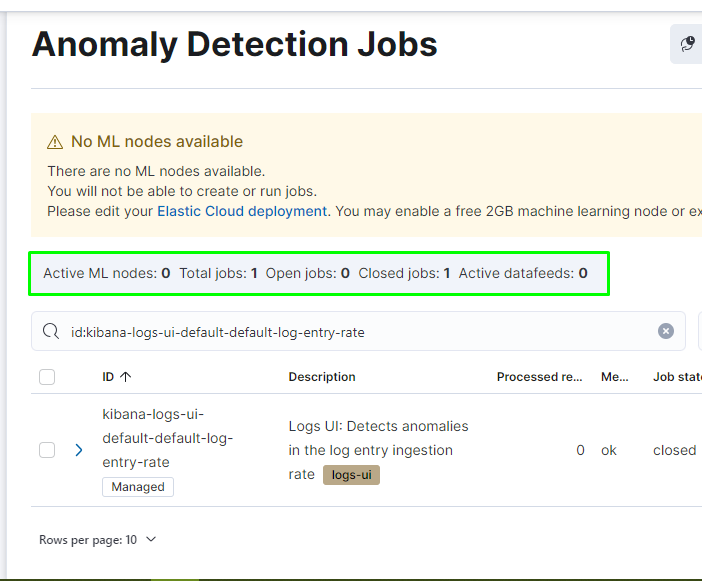
The anomaly detection service is set up and now the service will catch any abnormal activity happening in Elasticsearch logs:
Categories
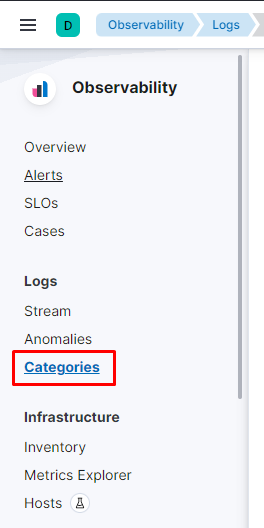
To analyze anomalies, click on the “Categories” button from the left panel on the “Logs” section:
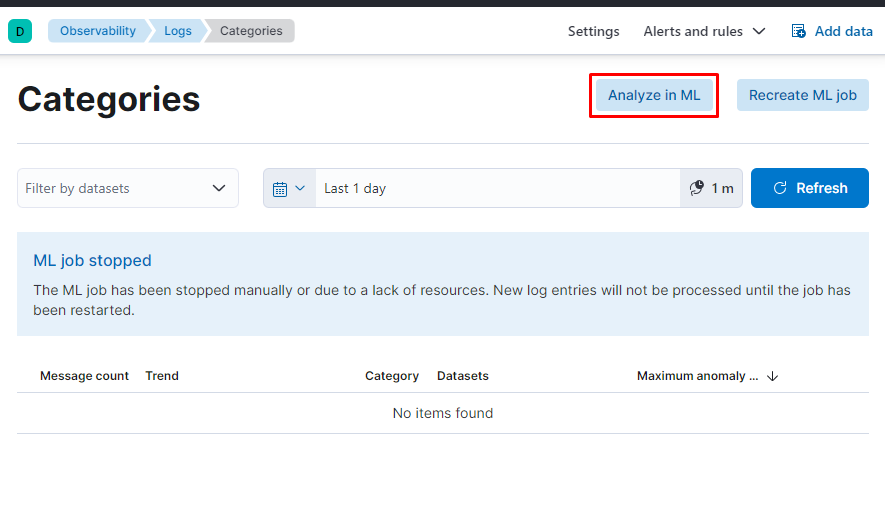
Click on the “Analyze in ML” button from the “Categories” page:
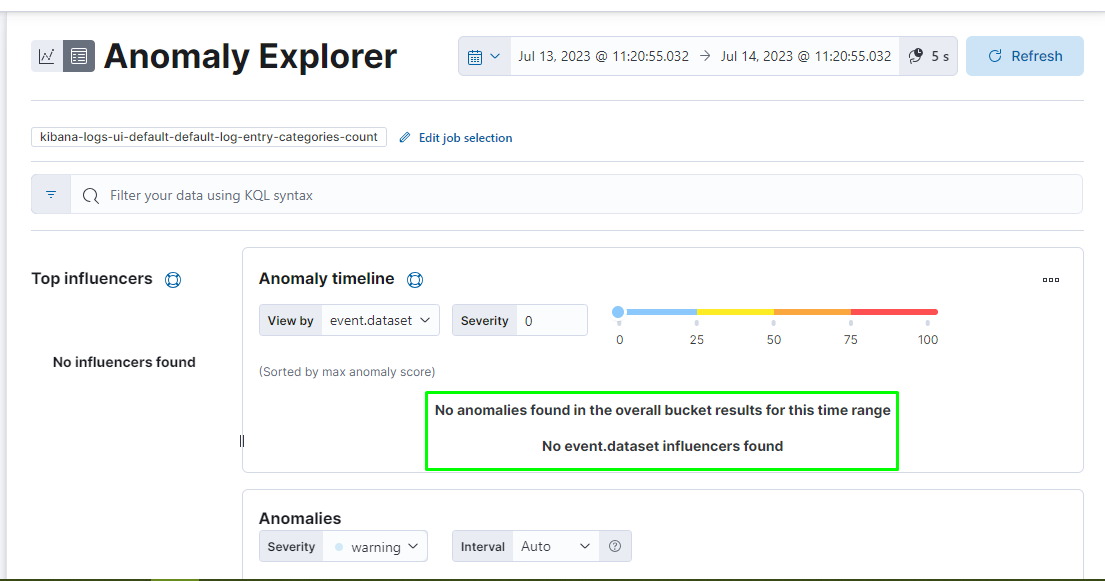
The anomalies will be categories and the timeline is created for anomalies to explore the problems in the activities:
That is all about the process of viewing the Elasticsearch logs from the Kibana user interface.
Conclusion
To view the Elasticsearch logs in Kibana, simply connect to Elasticsearch and Kibana by logging into the service. After that, visit the Logs page from the “Observability” section to view “Streams”, “Anomalies”, and “Categories” from the left panel. This guide has explained the process of viewing Elasticsearch logs from Kibana and configuring the anomalies and categories.