“Seaborn is a Python module for creating statistical visualizations based on matplotlib and pandas’ data structures. If we intend to visualize more than one variable with this seaborn module, we should clarify what each variable signifies. Legend(), a function in the seaborn module, can be used for this purpose. The legend is a little region on the graph that describes the meaning of each variable.
A legend is a little box that appears in one of the corners of the plot and describes the various plot features. It also identifies which component represents specific data if the graph has numerous data points.
There are three options for removing the legend in seaborn. They are as follows:
- using the legend parameter
- using the legend function
- using the remove function
From these methods, we will remove legend from the seaborn plot in python.”
Example 1
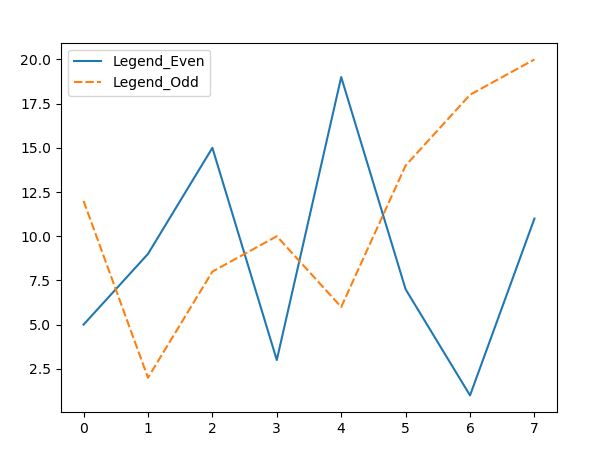
Firstly, we have shown to generate the legend in the seaborn plot in this example. We have imported the necessary libraries for the construction of the plot. These libraries include the matplotlib, pandas, and the seaborn with the specified alias. Then, we created the data frame by using the panda’s module. Here, we have specified two fields: even or odd. The even field has random even numbers, and the odd field has odd random integers. The data frame is created for the comparison in the plot.
We have rendered a line plot which is why we have called the line plot function and passed the data set inside it. The legend function is invoked where we have specified the label for the legend as Legend_even and Legend_odd. This label will appear inside the legend of the line plot. The sample code for this instance is affixed here and can be altered if required.
import matplotlib.pyplot as plt
import seaborn as sns
df = pd.DataFrame({"even": [5, 9, 15, 3, 19, 7, 1, 11],
"odd":[12, 2, 8, 10, 6, 14, 18, 20]})
sns.lineplot(data=df)
plt.legend(labels=["Legend_Even", "Legend_Odd"])
plt.show()
The legend pops up at the upper side of the line plot with the given labels. Now, we will see the approaches that remove the legend from the plot in the coming examples.
Example 2
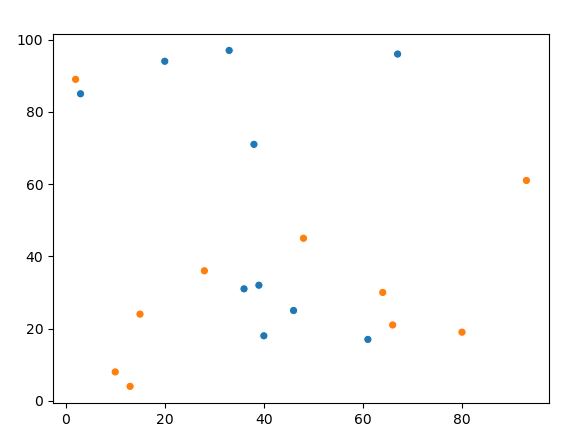
The legend parameter is accepted by most plot functions in seaborn. We can change it to False, and the legend will be removed from the final plan. In the following script, we have included the essential python modules for plotting. After that, we have used a random module for generating the random numbers in the sample function where the range is specified. The two variables are used for generating the random numbers, which are represented as Data1 and Data2. The other variable, Values, has the for loop, which iterates over each axis of the plot.
We have used the scatter plot and defined the x and y parameters values with the hue parameter. The legend parameter is also specified in the scatter plot to which we have assigned a false value. Now, it will not pop up in the plot. The sample code for this instance is affixed here and can be altered if required.
import seaborn as sns
import matplotlib.pyplot as plt
Data1 = random. sample(range(0, 100), 20)
Data2 = random. sample(range(0, 100), 20)
Values = [i for i in range(2)]*10
sns.scatterplot(y=Data2, x=Data1, hue=Values, legend=False)
plt.show()
Note that the following plot visualization has no legend. As we have set the legend parameter to false, that’s why the legend appears in the plot.
Example 3
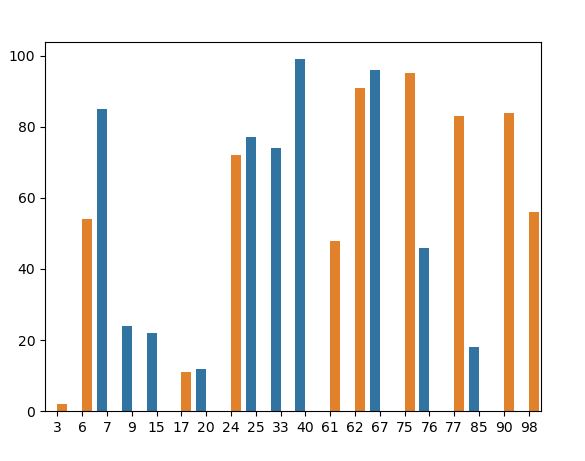
A custom legend can be added to seaborn plots using the matplotlib.pyplot.legend() function. Since the seaborn module is constructed on the upper edge of the matplotlib module, we may utilize it. We can remove the legend’s frame and replace it with an empty legend. We can remove the legend from the figure in this method.
In the following example, we have first added the basic libraries of python. The variables are established as Sample1 and Sample2. To these variables, we have assigned a random.sample command inside which the range function is defined with the values.
Then, we have an iteration loop that iterates over each axis of the plot. This time, we have a barplot where the x argument is set with Sample1, and the y argument is set with Sample2 along with the hue argument. The hue argument has been set with the Values variable. In the final step, we have a legend function, and every axis now has the empty legend that was created with the above function. The sample code for this instance is affixed here and can be altered if required.
import seaborn as sns
import matplotlib.pyplot as plt
Sample1 = random.sample(range(0, 100), 20)
Sample2 = random.sample(range(0, 100), 20)
Values = [i for i in range(2)]*10
sns.barplot(x=Sample1, y=Sample2, hue=Values)
plt.legend([], [], frameon=False)
plt.show()
With the legend function, too, we can easily take away the legend from the plot as there is no legend appearing inside the given barplot visuals.
Example 4
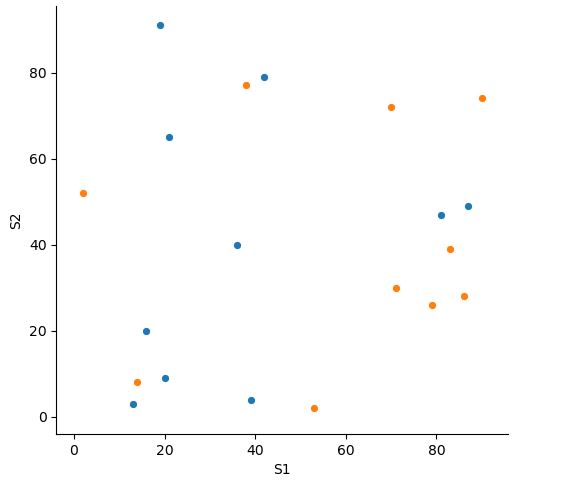
This method can be used to work with objects from other classes, such as the PairGrid module from the seaborn library. The PairGrid class object is returned by the pairplot() function. This approach also works with the seaborn module’s FacetGrid objects. The legend() function can be used to access the legend, and the remove() method can be used to get rid of it.
As we have included some python modules in the first step of our script. Now, we have created the data which is utilized for creating the plot. The range is specified by calling the range function. Then, we have a for loop that cycles over each axis of the plot. The pandas dataframe is invoked, which takes the S1, S2, and Values as an argument, and now we can access the data for the plot. We have constructed a variable Graph and called a seaborn pairplot inside it. The seaborn pairplot has the data parameter as df, x_vars parameter as S1, y_vars parameter as S2, and the hue parameter which has the Values option.
Then, we have a legend_remove function which we have applied to the Graph. This will remove the legend from the graph. The sample code for this instance is affixed here and can be altered if required.
import seaborn as sns
import matplotlib.pyplot as plt
import pandas as pd
S1 = random.sample(range(0, 100), 20)
S2 = random.sample(range(0, 100), 20)
Values = [i for i in range(2)]*10
df = pd.DataFrame({'S1': S1, 'S2':S2, 'Values': Values})
Graph = sns.pairplot(data=df, x_vars='51', y_vars='52', hue='Values')
Graph._legend.remove()
plt.show()
Notice that the pairplot is generated without the legend option in the following graph.
Conclusion
Concluded with the seaborn remove legend article here. Through the legend parameter set to false and by using the legend function and remove function, the seaborn legend can be easily removed. So far, we have achieved our objective to remove legend from the plot. And we have noticed how easy it is to accomplish this.