The colormaps play a crucial role in creating visually appealing plots and visualizations in MATLAB. They allow us to assign colors to different elements in a plot based on their data values, making it easier to interpret and understand the information presented. In this guide, we will explore how to effectively use colormaps in MATLAB to enhance the visual impact of our plots.
What is MATLAB Colormap?
The colormaps are a set of colors that we can use to represent numerical data visually. They assign specific colors to different values, creating a visual representation of the data. By utilizing colormaps, we can highlight patterns, variations, and trends in our plots, making them more informative and engaging.
Why Use MATLAB Colormaps?
Using colormaps in MATLAB helps us to effectively communicate information through colors. We can visualize different regions, gradients, or levels in our data using distinct colors. Colormaps allow us to transform numerical values into visually appealing representations, making it easier for others to understand the underlying patterns or trends in the data.
How to Use Colormaps in MATLAB?
There are many ways to use colormap in MATLAB that are given below:
- Set the Default Colormap
- Use Different Colormaps for Each Axis in Figure
- Specify the Number of Colors for the Colormap
- Return Colormap Values for Specific Axes
- Change Colormap for Figure with Image
Let’s discuss these methods in detail.
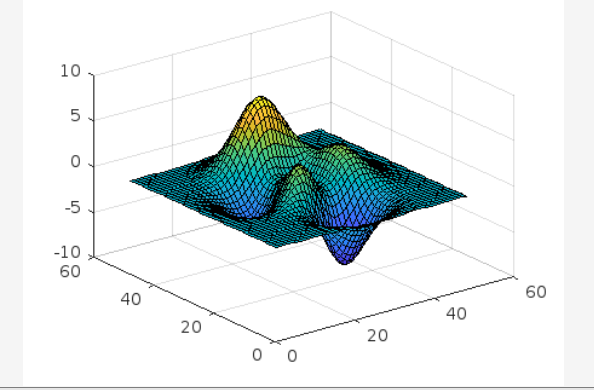
Method 1: Set the Default Colormap
This method demonstrates the usage of colormap as a default value. If the user does not specify any colormap the default value will be parula.
colormap default
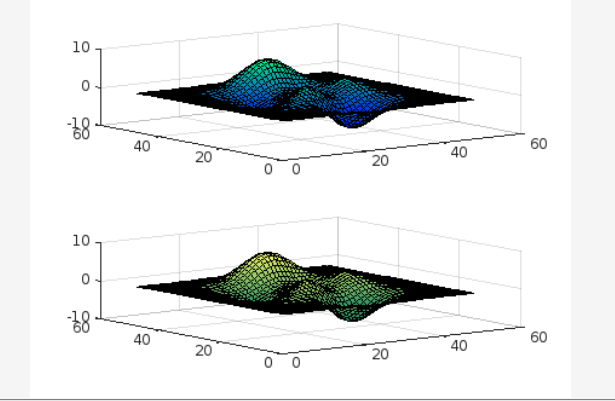
Method 2: Use Different Colormaps for Each Axis in Figure
This is another method that illustrates how to use different colormaps for every axis in the given figure. For this, we use tiledlayout() and nexttile functions to display the tilling of the plot. In our case, we will use tiledlayout() to create a 2-by-1 tiled chart layout and nexttile to create axes named ax1 and ax2. The colormap for each axe can be specified by passing the axes to the colormap function.
In the given example, we create a surface plot by using a winter colormap for ax1 and a summer colormap for ax2.
ax1 = nexttile;
surf(peaks)
colormap(ax1,winter)
ax2 = nexttile;
surf(peaks)
colormap(ax2,summer)
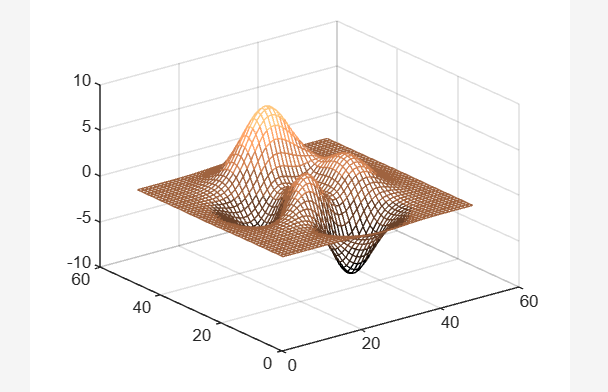
Method 3: Specify the Number of Colors for the Colormap
We can use the colormap by specifying the number of colors. We pass an integer value that represents the number of colors to the colormap function. In the given example, we use 7 colors from copper colormap.
colormap(copper(7))
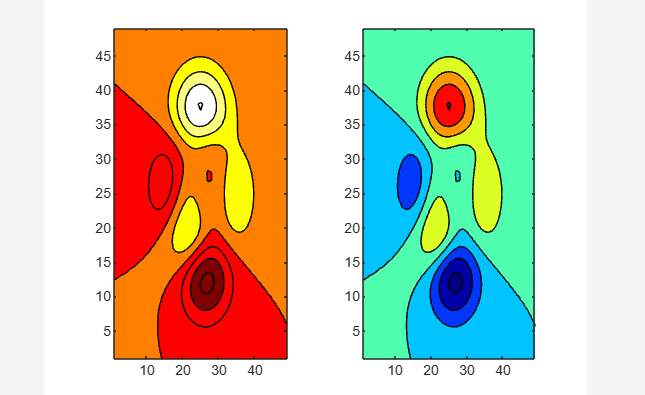
Method 4: Return Colormap Values for Specific Axes
You can also use the Colormap function to retrieve values from specific axes. In our case, we will utilize the tiledlayout() function for generating a 1-by-2 tiled chart layout. We will then use the nexttile function to create two axes named ax1 and ax2.
Once the axes are created, we can display two filled counterplots by applying different colormaps to each of them. Here’s an example.
ax1 = nexttile;
contourf(peaks)
colormap(ax1,hot(6))
ax2 = nexttile;
contourf(peaks)
colormap(ax2,jet)
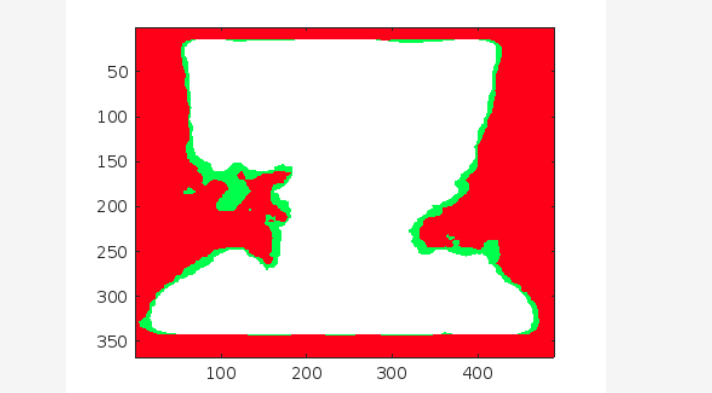
Method 5: Change Colormap for Figure with Image
To demonstrate this use of colormap let’s consider an example in which first, we define a colormap named mymap. Then load the spine data set that gives an image x and its associated colormap. After that, we display the image by changing its colormap by specifying the defined mymap in the colormap() function.
load spine
image(X)
colormap(mymap)
Conclusion
The colormaps play a vital role in enhancing the visual appeal of MATLAB plots and visualizations. By assigning colors to data values, colormaps provide a visual representation that helps interpret and comprehend information effectively. This guide explores the usage of colormaps in MATLAB to create visually impactful plots, highlighting patterns and trends within the data.