This guide will explore how to add the title to a figure in MATLAB using the title() function.
How to Add Title to a Figure in MATLAB
MATLAB has a wide built-in functions library to perform many tasks. One such function is the title() function which is responsible for creating titles and subtitles in a figure in MATLAB. This function accepts a string containing the title of a figure as an input and adds that title to the specified figure.
Syntax
The title() function uses different syntaxes in MATLAB, which are as follows:
title(titletext,subtitletext)
title(___,Name,Value)
Here,
- The function title(titletext) is responsible for adding a figure title. We can also implement this function for replacing the old title with a new title.
- The function title(titletext, subtitletext) is responsible for adding the subtitle under the title.
- The function title(___,Name,Value) is responsible for modifying the appearance of a title utilizing one or more Name, Value pair parameters.
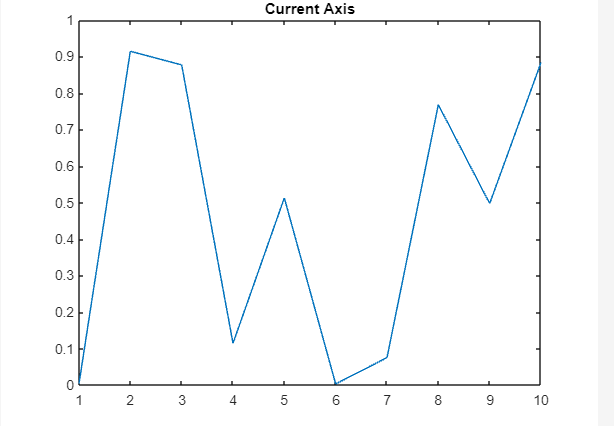
Example 1: How to Add Title to a Figure in MATLAB
This MATLAB code creates a 2D plot corresponding to the given expression using the plot() function. After that, it uses the title() function to add a title to the generated plot.
title('Current Axis')
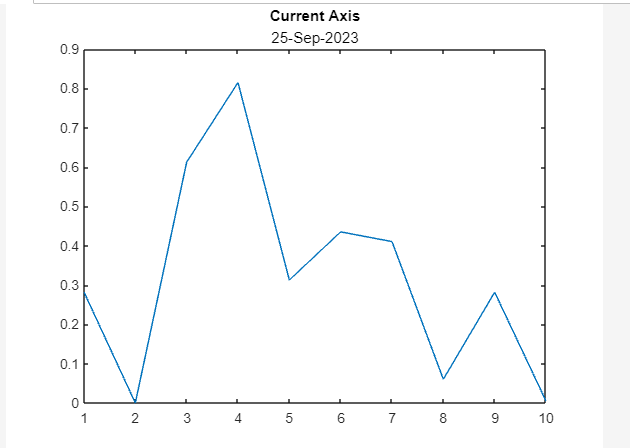
Example 2: How to Add Subtitle to a Figure
In this example, we create a 2D plot using the plot() function and add title and subtitle to the current axis of the created plot using the title() function.
title('Current Axis',date)
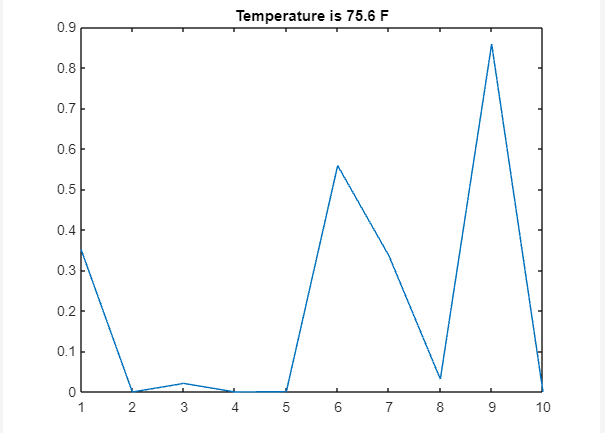
Example 3: How to Add Variable’s Value in Title
In this example, we create a 2D plot using the plot() function and add the f variable’s value in the title of the created plot using the title() function.
plot(rand(1,10).^3)
c = 10;
f = 9/5*(c+32);
title(['Temperature is ',num2str(f),' F'])
Conclusion
Adding a title to a figure is the most common task used for figure identification. With MATLAB, we can quickly perform this task using the built-in title() function that accepts a title string as an input argument and adds that title to the given figure. This article has provided in detail how to use the title() function in MATLAB with different syntaxes and an example for each syntax. This will help us understand the working of the title() function in MATLAB.