Basic logging in Kubernetes with Pods
Initially, we have to create a configuration file for pods with the help of the “touch” command. We have named it “logs.yaml”.
![]()
Upon the execution, the file can be seen in the home directory of the system.
The logs from an operating pod are by far the most normal thing you would like to look at. The kubectl command contains a log operation that provides insight into your operating pods and offers various choices for fast getting what you need. In the following illustrations, I will use a basic container that prints a timestamp every second. We have named it as “example” (displayed in line #7)

Use the following command to launch this pod:
![]()
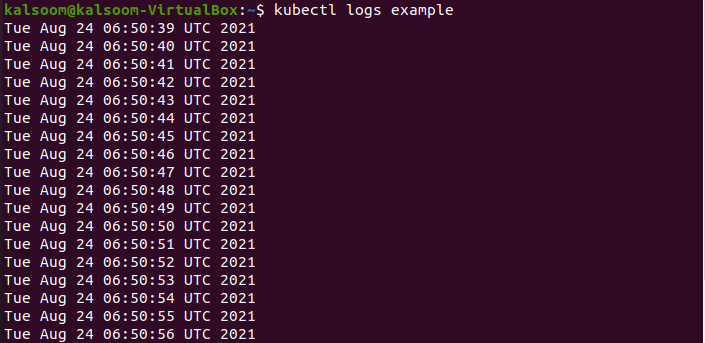
The output depicts that it has been created effectively. Let’s have a glance at the logs after we have deployed this pod. We can do this by using the kubectl log example command, which should produce the following output. You won’t have to access nodes in the cluster if you use kubectl to retrieve logs. Kubectl can only display the logs of a single pod at a time.
Now execute the below command as:
Basic logging in Kubernetes with Deployments
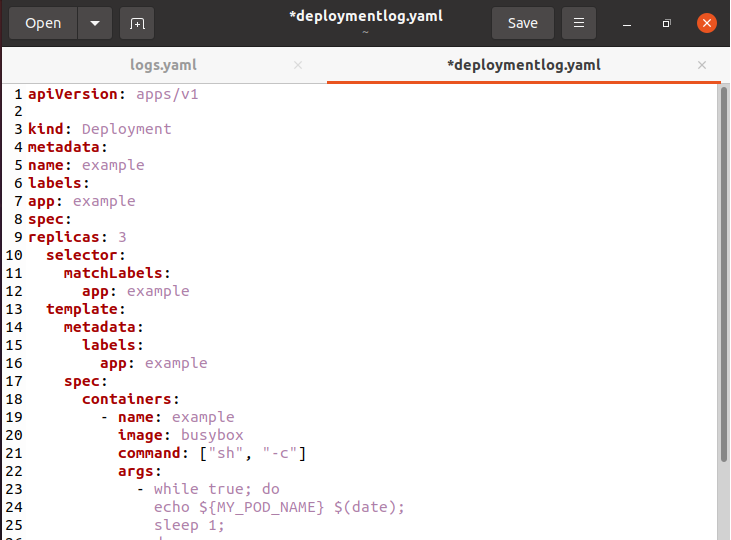
Initially, we have to create a configuration file for deployments with the help of the “touch” command. We have named it “deploymentlog.yaml”.
![]()
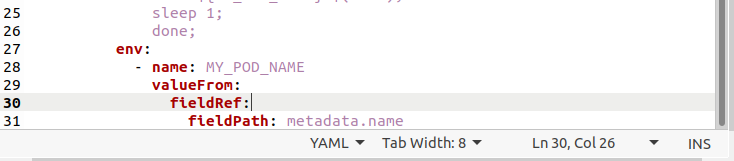
Upon the execution, the file can be seen in the home directory of the system. The below is the deployment descriptor:
Use the following command in the Ubuntu 20.04 terminal to launch this deployment:
![]()
The output depicts that it has been created effectively. Each pod will now display its name as well as the time stamp. Utilize kubectl log deployment/example to keep track of all those different pods and their generating logs. Unfortunately, this will only choose one of the pods. There is, however, a technique to examine all of them. Look at the aforementioned command and execute it in Ubuntu 20.04 terminal:
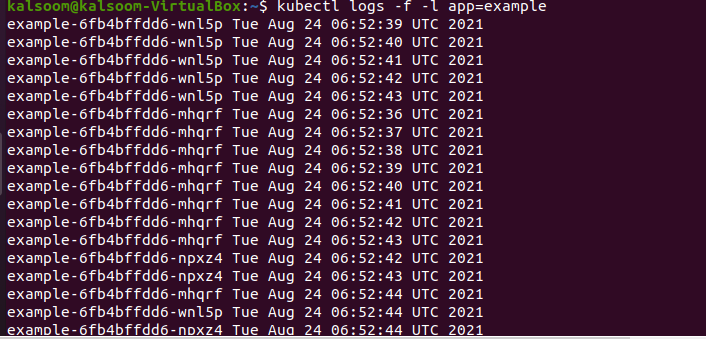
The “–l” flag allows you to filter results by label. We could see some of our deployment pods because we labeled them with the example label. The “–f” flag then displays the output from those pods constantly. We need to keep the number of logs coming out to a minimum now that we have received them. If you pick one pod by default, it will display everything. If you are using a selector to select several pods, it will only produce 10 lines per pod, as shown in the below-cited command presented in the attached image.
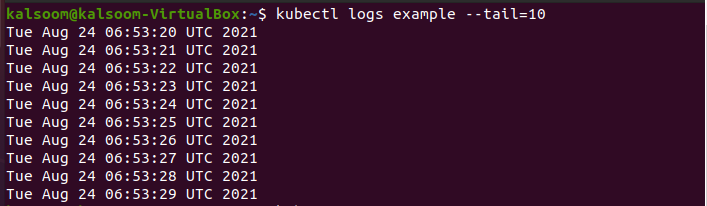
If you are using a selection and want more logs per pod than the last ten, simply raise the “–tail” number to the appropriate amount of logs. If you only output, the pod’s logs are grouped. It does not bring the outcomes together. Now execute the below-affixed command in the terminal.
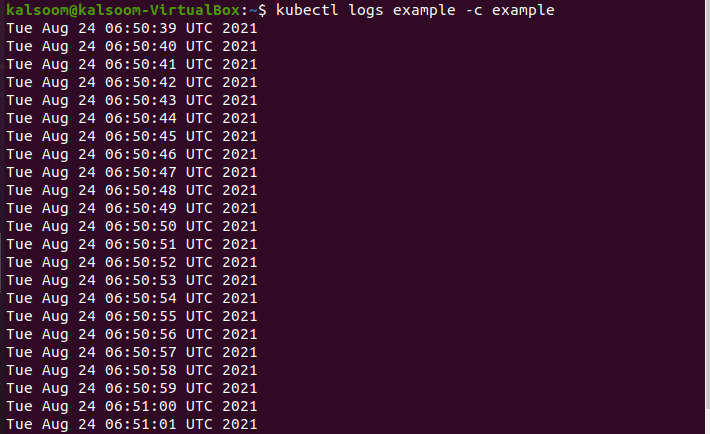
The “–c” flag specifies which container the logs should be obtained from. Now execute the appended displayed command in the shell.

The log messages are often at the end, and the timestamp is at the start, as you can see from the example above. This can assist you in figuring out where the log message came from and when things happened, particularly if the log text doesn’t have an integrated timestamp. The “–timestamp” flag on the kubectl command prefixes each record with a timestamp.
Conclusion
Overall, Kubernetes tail logs include a lot of information regarding your cluster and apps’ health. “Kubectl logs” is good for getting started with Kubernetes, but it quickly demonstrates its limitations. Hopefully, this guide has helped you become more familiar with the kubectl logs instruction and will assist you in reviewing the logs in the Kubernetes cluster.