What is Sysdig?
Sysdig provides complete visibility into Kubernetes throughout the entire Sysdig product line. It is the only monitoring platform designed from the bottom level to support microservices and containers. It includes Sysdig cloud, CLI system exploration tool, out open-source, and sysdig. By design, sysdig manages everything, starting from system calls to events collecting directly from Linux Kernel. It singles handily performs everything that a Wireshark, Isof, iftop, htop, tcpdump, and strace does, which implies one tool instead of six.
Moreover, Sysdig is familiar with the entire Kubernetes cluster hierarchy, starting from handling labels, services, and namespaces to managing containers while having your back when you need to troubleshoot these microservices on Linux. Despite being a command-line tool, Sysdig provides a Ncurses user interface to allow monitoring the data and information easily.
All in all, Sysdig is your go-to tool for all kinds of Kubernetes development as it allows you to monitor and troubleshoot your code easily. Let us use Sysdig.
Prerequisite
Let us install Sysdig on the Ubuntu 20.04 Server. You can easily install Sysdig into either Red Hat or Debian based distribution. However, you’ll need an Ubuntu server and a user with sudo access. Moreover, you must have a runtime engine to deploy and monitor containers. We will be explaining the detailed WordPress deployment in Sysdig with the Docker engine. So, let’s start the minikube to prepare your system for Kubernetes deployment. Just type in ‘minikube start’ in your command line window, and you are good to go. Have a look at the system output:
After successfully starting minikube, your system is ready to install Sysdig, so let us install it. Quickly log in to your Ubuntu server and provide the following command:
The system will connect with the amazon AWS server to download and install Sysdig into your Ubuntu server. With the newest Sysdig version, it will install all of the requirements. You can observe that in the above output as well.
How to Deploy a WordPress Docker Container?
Now is the time to deploy something that can monitor and troubleshoot the installed Sysdig, and we are starting with deploying a WordPress Docker container. Follow the steps given below so that you won’t miss anything:
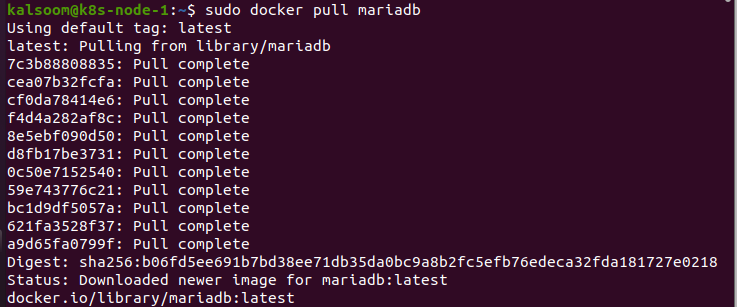
First thing first, get the mariadb container. Type in the following command into your CLI to pull the mariadb container:
Note that the pull is complete, and the status is latest which means the latest version of mariadb is successfully pulled from the library.
Use the following commands to create multiple folders that hold up all the WordPress data.
Now that everything is ready, let’s create a mariadb container with the command given below:
Note that there are two passwords given, PWORD1 and PWORD2, which are unique as well as strong passwords.
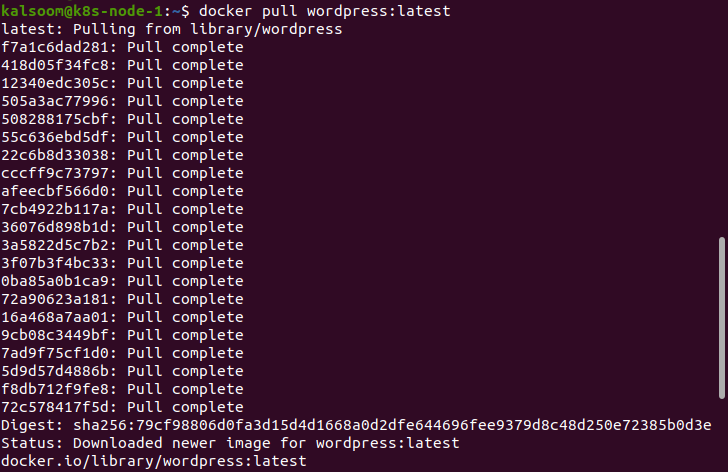
The next step is to pull the latest edition of WordPress with the following command:
Note that the WordPress pull from the library is complete, and the status is the latest, interpreting that the latest version of WordPress has been successfully pulled from the library.
The WordPress container must be deployed as the final step. You must enter the PWORD2 that you created in the previous step here. Moreover, you can request access to port 8081 now and complete the installation of WordPress.
Now that WordPress is installed successfully and we have something to look at let’s learn to use Sysdig.
How to Use Sysdig?
Here we use the ncurse CLI, so sysdig is replaced with csysdig. We will be using six different commands to monitor and troubleshoot csysdig.
Let’s see how many and what containers are running currently.
We have deployed only mariadb and WordPress, so it should list them both. The listing also provides the details like Container ID, the engine being used, files, resident memory, virtual memory, threads, the number of associated processes, and CPU usage.
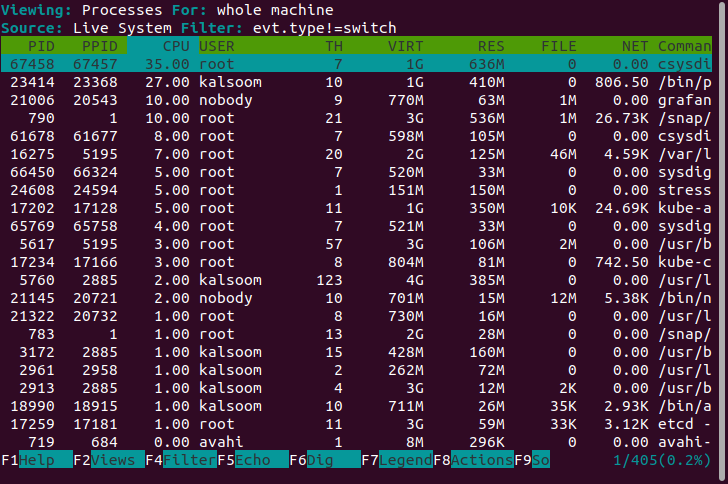
Now, let’s see all the processes associated with a container.
This will list the following things:
- Process ID – PID
- Parent PID – PPID
- Virtual PID – VPID
- CPU used
- USER name
- Virtual memory – VIRT
- Resident memory – RES
- FILE used
- Total network used – NET
- Container name
- Command used
See the detailed output below:
Suppose you get befuddled with a huge amount of information and cannot find what you are looking for. In that case, you can also choose to view information associated with a particular container.
View all the information that is linked with only the WordPress container.
Now, you only see the five things specifically associated with WordPress.
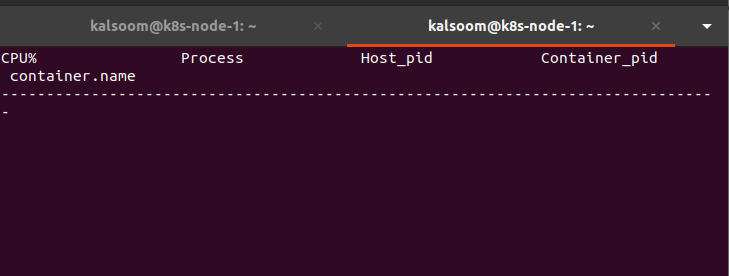
Check the net I/O of the WordPress container.
Again, it listed only five things specifically associated with WordPress.
Remember that the above command will only give you data when there is actual network traffic.
View the file associated with WordPress container I/O.
Again, this command also shows data only when the files are used.
Switch the view mode in sysdig with the ‘sudo cysydig’ command.
Conclusion:
In this article, we have used two powerful tools: csysdig and sysdig. These tools allow us to monitor and troubleshoot the container deployments from CLI. Each and every step to utilising and installing this tool has been explained in detail for our readers.


