This blog will discover how to implement the xlim() function to learn how to set or query the x-axis limit in MATLAB.
Why Setting the Axis Limit is Important
Setting the axis limit is important since it helps us visualize the plot more clearly. It also ensures that all the data points on the plots are displayed within the plot frame, making it easier for us to interpret the plot.
How to Set or Query X-axis Limits in MATLAB
We can easily set or query x-axis limits in MATLAB using the built-in xlim() function. This function takes a two-element xmin and xmax vector, which denote the lower and upper limits of the x-axis, respectively. It also provides some optional arguments to customize a plot with the x-axis limits.
Syntax
In MATLAB, you can use the xlim() function in the following ways:
xlim(limit method)
xlim(limitmode)
xl = xlim
limmethod = xlim("method")
limmode = xlim("mode")
Here:
The function xlim(limits) sets the x-axis limits for the current chart or axis. The variable “limits” represents the two-element vector that contains an upper limit and a lower limit. The upper limit must be greater than the lower limit.
The function xlim(limit method) sets the limits of the x-axis by specifying the limit methods. These methods include padded, tight, or tickaligned. These methods are not supported for the standalone visualizations.
The function xlim(limitmode) sets the limits of the x-axis by specifying manual or automatic limit selection. The limitmode variable can hold one of the given two values:
- auto – This value allows the automatic limit selection. MATLAB enables us to choose the limit on the basis of the range of the data and the XLimitMethod property’s value.
- manual – This value enables us to keep the x-axis limits at their current values.
The function xl = xlim provides the current limits as a vector of two elements.
The function limmethod = xlim(“method”) provides the current limit method of the x-axis limits that can be padded, tight, or tickaligned.
The function limmode = xlim(“mode”) provides the current limit mode of x-axis limits that can be auto or manual. By default, this mode is automatic.
Example 1: How to Set and Return X-axis Limits?
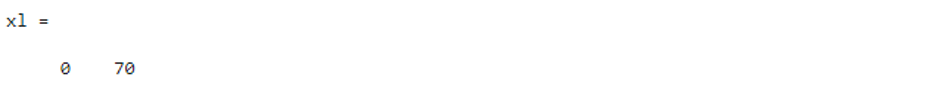
This MATLAB code sets the given x-axis limits using the xlim(limits) function and returns the current x-axis limits using the xlim function.
y = x.^2;
plot(x,y)
xlim([0 70])
xl=xlim
Example 2: How to Set and Return the X-axis Limit Using Method Property?
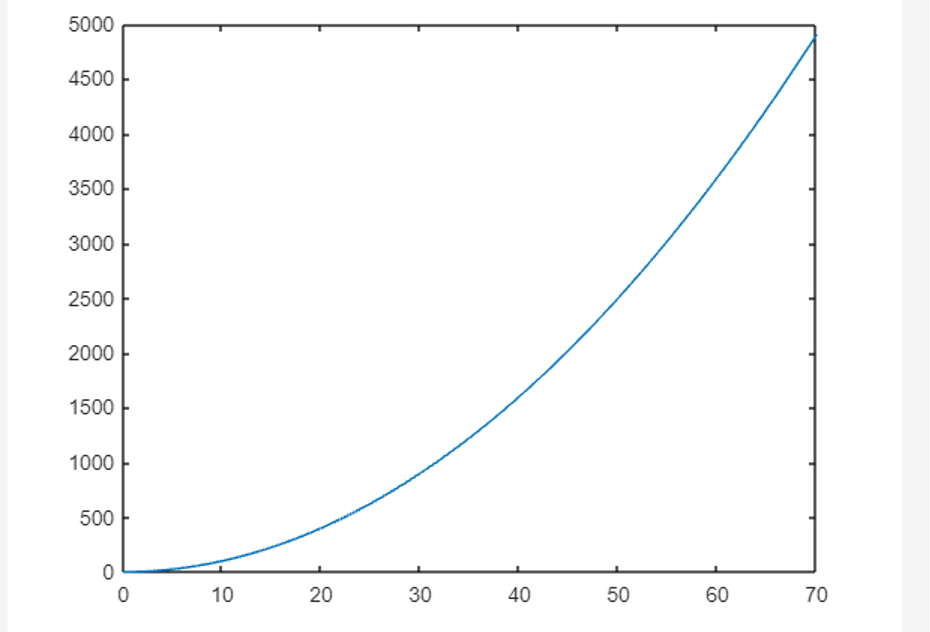
In this example, we use the xlim(“limitmethod”) function to set the x-axis limit method to padded and then return the current limit method using the xlim(“method”) function.
y = x.^2;
plot(x,y)
xlim("padded")
xlim_method=xlim("method")

Example 3: How to Set and Return X-axis Limit Using Mode Property?
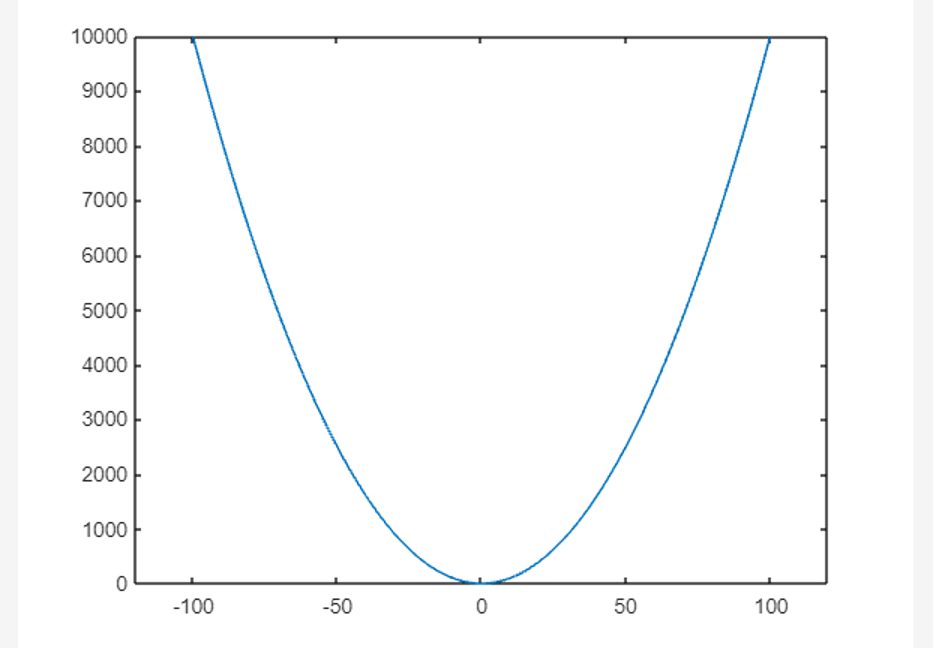
In this MATLAB code, we use the xlim(“limitmode”) function to see the x-axis limit mode and then return the current limit mode using the xlim(“mode”) function.
y = x.^2;
plot(x,y)
xlim("manual")
xlim_mod=xlim("mode")

Conclusion
Setting 2D or 3D data visualization in MATLAB considers the axes limit from the ranges of the given x and y vectors. We can modify these axis limit values using the MATLAB built-in functions. One such function in MATLAB is xlim() which allows us to set or query x-axis limits. This guide has presented the implementation of the xlim() function using different syntaxes and examples.