Are you looking to visualize your data in a histogram using MATLAB? Histograms are powerful tools that help us understand the distribution of data. By setting the height of histogram bars, we can emphasize specific information or customize the visualization to suit our needs.
This article will provide a simple and comprehensive guide to setting the height of the histogram bar in MATLAB.
How to Set the Height of Histogram Bar in MATLAB
Before moving toward the process of setting the height of histogram bar in MATLAB, it is better to understand its importance of it.
Why Set the Height of Histogram Bars?
Histograms offer a clear representation of the frequency distribution of a dataset, displaying the number of occurrences within specific intervals or bins. While MATLAB provides default settings for histogram displays, adjusting the height of the bars allows you to highlight important features or focus on specific ranges, thus, helping you enhance the interpretation of your data.
Here are the guidelines for setting the height of a histogram bar in MATLAB.
Step 1: Import your Data
First, it is important for you to import your dataset in MATLAB. This can be done using various methods, such as loading a file or generating data through a script or function.
For example, in the below-given syntax, we are generating random data from the built-in rand function.
The above instruction will generate a random array of numbers in MATLAB, where n represents the desired number of elements in the array.
Step 2: Create a Histogram
After generating the data, you must use the histogram function in MATLAB to create a basic histogram of your data; for that reason, you have to specify the dataset as an input to this function.
histogram(data); % Create a basic histogram using the 'histogram' function
In the above code, data represents the array of random numbers generated using rand(1, n). By passing data as input to the histogram function, MATLAB will create a histogram with default settings.
Step 3: Customize the Histogram
MATLAB offers several customization options that help you modify the histogram appearance. If you want to set the height of histogram bars, you can adjust the properties of the histogram object using the following syntax.
h.BinWidth = 0.1; % Adjust the width of each bin
h.Normalization = 'count'; % Set the normalization to 'count' to represent the frequency
h.FaceColor = 'blue'; % Set the color of the histogram bars
h.EdgeColor = 'black'; % Set the color of the histogram edges
% Additional properties you can modify:
% h.BinLimits = [lower_limit upper_limit]; % Specify the range of bins
% h.BinEdges = bin_edges; % Specify custom bin edges
In the above code, h stores the histogram object created using the histogram function. To modify the properties of h, such as BinWidth, Normalization, FaceColor, and EdgeColor, you can customize the histogram appearance bars according to your preferences. Additionally, you can also adjust other properties like BinLimits or BinEdges to further customize the histogram.
Step 4: Adjust Histogram Bar Heights
To modify the height of the bars, you can change the values of the BinCounts property of the histogram object that allows you to specify the number of occurrences in each bin.
newBinCounts = [5, 10, 3, 7]; % Specify the desired number of occurrences in each bin
h.BinCounts = newBinCounts; % Assign the new bin counts to the BinCounts property
In the code above, newBinCounts is an array representing the desired number of occurrences in each bin. By assigning this array to the BinCounts property of the histogram object h, you can adjust the heights of the bars accordingly.
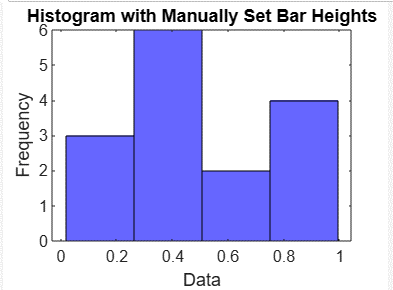
Step 5: Manually Set Histogram Bar Heights
If you prefer to manually set the height of each bar, you can assign an array of values to the BinCounts property. These values should correspond to the desired heights for each bin.
desiredHeights = [3, 6, 2, 4]; % Specify the desired heights for each bin
h.BinCounts = desiredHeights; % Assign the array of desired heights to the BinCounts
Step 6: Visualize the Modified Histogram
After setting the bar heights, you have to plot the modified histogram using the plot or bar functions in MATLAB. This will help display your data with the specified heights for each bar.
Here is a complete MATLAB code that follows the above-given steps:
data = rand(1, n); % Generate random data
% Specify the desired number of occurrences in each bin
desiredHeights = [3, 6, 2, 4]; % Specify the desired heights for each bin
% Calculate the corresponding bin edges
edges = linspace(min(data), max(data), numel(desiredHeights)+1);
% Create a histogram using the desired bin edges and assign the desired heights
h = histogram('BinEdges', edges, 'BinCounts', desiredHeights);
% Customize the histogram appearance
h.FaceColor = 'blue'; % Set the color of the bars
h.EdgeColor = 'black'; % Set the color of the edges
% Plot the modified histogram
xlabel('Data'); % Set the x-axis label
ylabel('Frequency'); % Set the y-axis label
title('Histogram with Manually Set Bar Heights'); % Set the title of the histogram
Conclusion
Setting the height of the histogram bar is useful, as this will help the user clearly visualize the data shown on the bar. This article provided a useful step-by-step guide to set the height of a histogram by importing the data, creating a histogram, customizing the histogram, adjusting, or manually setting the bar heights, and then visualizing the histogram bar by executing the code in MATLAB. Getting a clear understanding of how to set the height of the histogram bar will help users adjust the height according to their choice.