This blog will focus on creating scatter plots in MATLAB using the scatter() function.
How to Create Scatter Plot in MATLAB Using scatter() Function?
A scatter plot is a plot used for plotting discrete coordinate points. These plots are widely used in data science and statistics because they have statistical importance to visualize large data sets. MATLAB allows us to create scatter plots using the built-in scatter() function. The scatter() function by default uses a circular marker style to visualize the data set.
Syntax
The scatter() function follows a simple syntax that is given below:
scatter(x,y,sz)
scatter(x,y,sz,c)
Here:
The function scatter(x,y) produces a scatter plot with circular markers placed where the vectors x and y are specified.
- Set x and y as equal-length vectors to plot a single set of coordinates.
- We must specify at least one x or y as a matrix in order to plot various coordinate sets on the same set of axes.
The function scatter(x,y,sz) is used for specifying the circle size. If we specify sz as a scalar, all the circles will be the same size on the other hand, if we specify the sz as a vector then all the circles have different sizes.
The function scatter(x,y,sz,c) is used for specifying the colors of the circles. All the circles can have the same color, or the colors can be changed.
Examples
Let’s consider some examples to understand how to create a scatter plot in MATLAB.
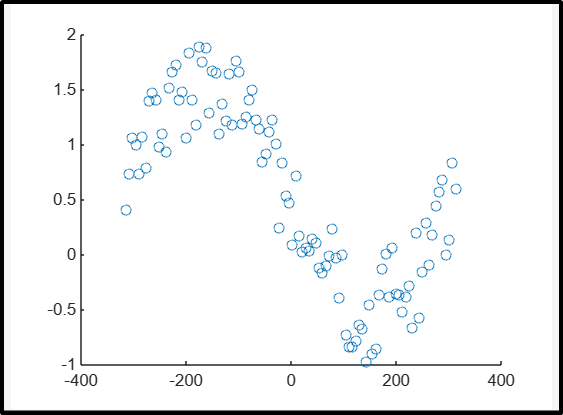
Example 1: Generate Scatter Plot Using scatter(x, y) Function
In the given example, we create a scatter plot using the scatter(x, y) function.
y = sin(x) + rand(1,100);
scatter(x,y)
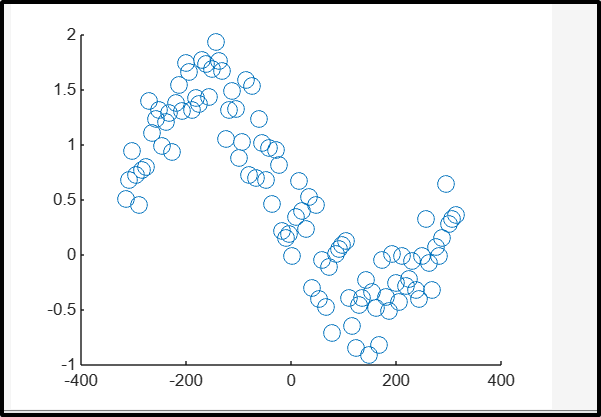
Example 2: Generate Scatter Plot Using scatter(x, y,sz) Function
This example generates a scatter plot using the scatter(x, y, sz) function by defining the circle size sz = 100.
y = sin(x) + rand(1,100);
scatter(x,y, 100)
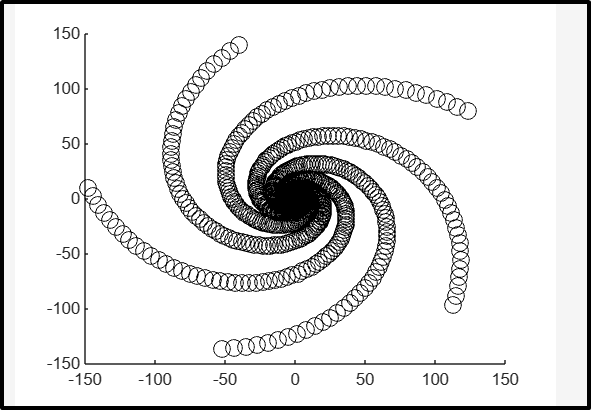
Example 3: Generate Scatter Plot Using scatter(x, y,sz,c) Function
This MATLAB code creates a scatter plot using the scatter(x, y, sz, c) function by specifying the circle size sz = 100 and color c = black.
x = exp(t).*cos(500*t);
y = exp(t).*sin(500*t);
s = scatter(x,y, 100, "black");
Conclusion
The scatter() is a useful built-in function that allows you to create scatter plots in MATLAB. These plots have many applications in statistics and data science due to their statistical importance to visualize large data sets. This guide has covered the basic process of creating scatter plots in MATLAB with some simple examples, allowing users to make scatter plots with marker size and colors.