Saving the figures and plots in MATLAB is an important task since it can help you to use them in your thesis, research paper, or any other documentation. By default, MATLAB does not save your figures or plots, but with the right function, you can quickly save them in your local folder. The saveas() function in MATLAB will help you in saving your MATLAB figures and plots, allowing you to use them in your documentation or share it with others.
If you are not familiar with the working of the saveas() function, this guide will help you in getting used to this function in MATLAB.
How to Save Figures in MATLAB Using the saveas() Function?
The saveas() is a built-in function in MATLAB that enables us to save the figure in a specific file format. Using this function, we can save a figure in different formats such as jpg, png, and so on. This function accepts the figure and file name as mandatory arguments and the file format type as an optional argument.
Syntax
The saveas() function’s syntax in MATLAB is given below:
saveas(fig,filename,formattype)
Here:
The function saveas(fig, filename) saves the figure fig to the file filename. The filename should be defined as a character, string, or vector having an extension. For example, filename.jpg. If you do not specify the extension, this function will save the figure in the .fig format by default.
The function saveas(fig, filename, formattype) saves the figure fig to the file filename in the specified file format type. This format can have a type of jpg, png, jpeg, or many others.
Example
Consider some examples to understand the implementation of the saveas() function in MATLAB.
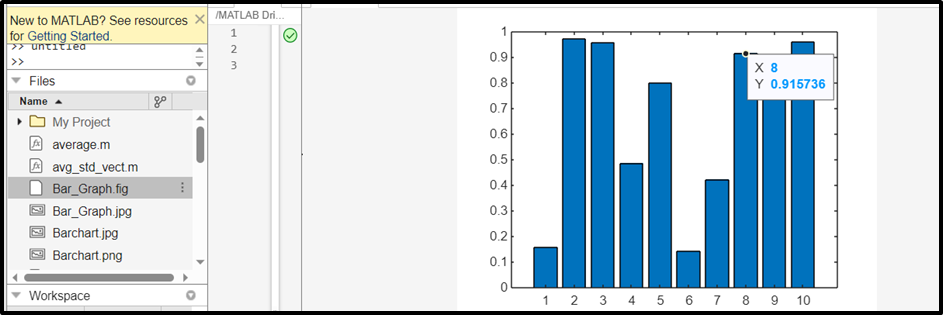
Example 1: How to Save a Figure as a Default File in MATLAB?
This example creates a bar chart using the bar() function and saves it in the default format using the saveas() function in MATLAB.
bar(x);
saveas(gcf,'Bar_Graph')
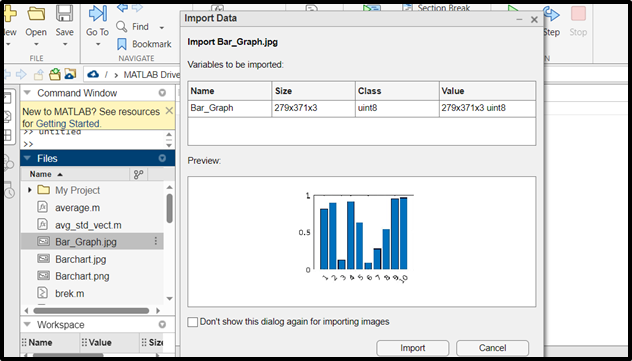
Example 2: How to Save a Figure as a jpg File in MATLAB?
In this example, we create a bar chart using the bar() function and save it in the jpg format using the saveas() function in MATLAB.
bar(x);
saveas(gcf,'Bar_Graph.jpg')
Conclusion
Saving a figure in a specific format is a very common task mostly adopted by developers while developing applications. MATLAB makes this task easy by providing the saveas() built-in function. This function allows us to save the given figure in the specified file format. This guide has explored how to use the saveas() to save plots in MATLAB. Reading this guide will help you make your coding skills more efficient by saving your important figures right after executing the codes.