Printing and saving figures in MATLAB are crucial aspects of data visualization and sharing. With the print function, you can generate visually appealing figures and save them in various file formats like PNG, JPEG, PDF, or EPS. This article will provide a step-by-step guide on how to print figures in MATLAB, offering valuable insights and techniques to optimize your visual outputs.
How to Print Figure or Save to Specific File Format using MATLAB print Function
To print or save figures in MATLAB, we will use the print function that provides a wide range of options to customize the output and format of your figures. Here is a step-by-step guide to help you print the figure or save it to a specific file format.
Step 1: Generate Your Figure
Before printing or saving a figure, you need to create a figure in MATLAB. You can use the various plotting functions available in MATLAB to generate the desired plot, graph, or visualization that represents your data accurately.
Step 2: Configure the Figure
Once you have created your figure, you can further customize its appearance by adding labels, titles, legends, adjusting colors, and modifying other visual attributes. These modifications enhance the clarity and visual appeal of your figure.
Step 3: Choose the File Format
Decide on the specific file format in which you want to save or print your figure. MATLAB supports popular file formats such as JPEG, PNG, EPS, and PDF. Consider the requirements of your project or publication to select the most suitable format.
Step 4: Use the print Function
Now it’s time to use the print function to save or print your figure. The general syntax of the “print” function is as follows:
Replace the options and filename with the appropriate values according to your requirements. For example, to save a figure in PNG format, you can use the following command:
This will save your figure in the current directory with the name “myfigure.png”.
The following are supported options with image format and file extension.
| Option | Image Format | File Extension |
| ‘-djpeg’ | JPEG 24-bit | .jpg |
| ‘-dtiff’ | TIFF 24-bit (compressed) | .tif |
| ‘-dtiffn’ | TIFF 24-bit (not compressed) | .tif |
| ‘-dpng’ | PNG 24-bit | .png |
| ‘-dmeta’ | Enhanced metafile (Windows only) | .emf |
For more details, follow here.
Step 5: Customize the Output
The print function offers a variety of options to customize the output. You can adjust the resolution, figure size, orientation, or other settings to set the desired output quality. Refer to the MATLAB documentation for a comprehensive list of available options.
Step 6: Save or Print the Figure
Finally, execute the print function to save or print your figure. MATLAB will generate the output file in the specified format, which you can then access, share, or include in your project as needed.
Example
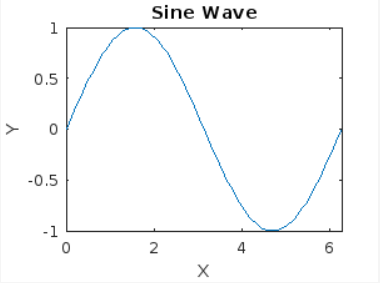
Here is a complete example that we have written by following the above-given steps:
x = linspace(0, 2*pi, 100);
y = sin(x);
plot(x, y);
% Configure the figure
title('Sine Wave');
xlabel('X');
ylabel('Y');
% Print the figure as a PNG file
print('-dpng', 'myfigure.png');
Once the above code is executed, it will save the file in your project folder.
Click the file to open it on MATLAB anytime.
Conclusion
Printing or saving figures in MATLAB is a crucial step in data visualization and analysis. By using the versatile print function, you can easily save your figures in various file formats, such as PNG, JPEG, PDF, or EPS. This allows for further exploration, documentation, sharing, and publication of your visualizations. By following the step-by-step instructions and customizing the output options, you can ensure that your figures are of high quality and meet the requirements of your project or publication.


