This tutorial will show you how to plot rectangles on our graphs using MATLAB’s rectangle() function.
Below, we will take a detailed look at the syntax along with a complete description of this function, its input, output arguments, and the accepted data types it uses to create and draw rectangles in our diagrams.
To help you better understand how this function works, we have prepared several practical examples that show the different usage modes and calls. We have also included code snippets and images that show how this rectangle() works in the MATLAB environment.
MATLAB Rectangle Function Syntax
rectangle ( 'Position', pos ,'Curvature', cur )
rectangle( ___, Name, Value )
rectangle ( ax, ___ )
r = rectangle ( ___ )
MATLAB Rectangle Function Description
The rectangle() draws this figure by taking the coordinates “x” and “y” specified in the input argument “pos” as a position reference and drawing a rectangle of size “width” and “height”, also specified in the input “pos”. This argument is a vector that concatenates these four parameters. Therefore, they must be explicitly enclosed in square brackets, separated by commas or implicitly by a previously created vector. Below, you can see what the syntax of this input argument looks like:
With this vector as an input argument, we can now call the function to draw a rectangle on an already created plot.
MATLAB also allows you to specify the curvature at the vertices of the rectangle, adjust the line style and width, add text, and work with different axes, which makes the rectangle() a very versatile function for working with plots. Below, we show a practical example of using the inputs that control these parameters. You will also see simple code snippets that you can copy and paste into the command console to begin implementing this function in the MATLAB environment.
How To Draw a Basic Rectangle in a MATLAB Plot
In this example, we create a rectangle with coordinates x1, y2, and dimensions 4 height by 2 wide.
When we use rectangle(), it is usually drawn on a graph already created and specified in the “ax” input arguments. If this function is called without a graph specified, it will draw it on the current axes. If no graph is available, square() will create it.
MATLAB has a relatively “standard” type and name of inputs that it uses for almost all functions. This adds advantage because remembering these inputs make the programming task manageable. This allows you to understand and implement new functions quickly.
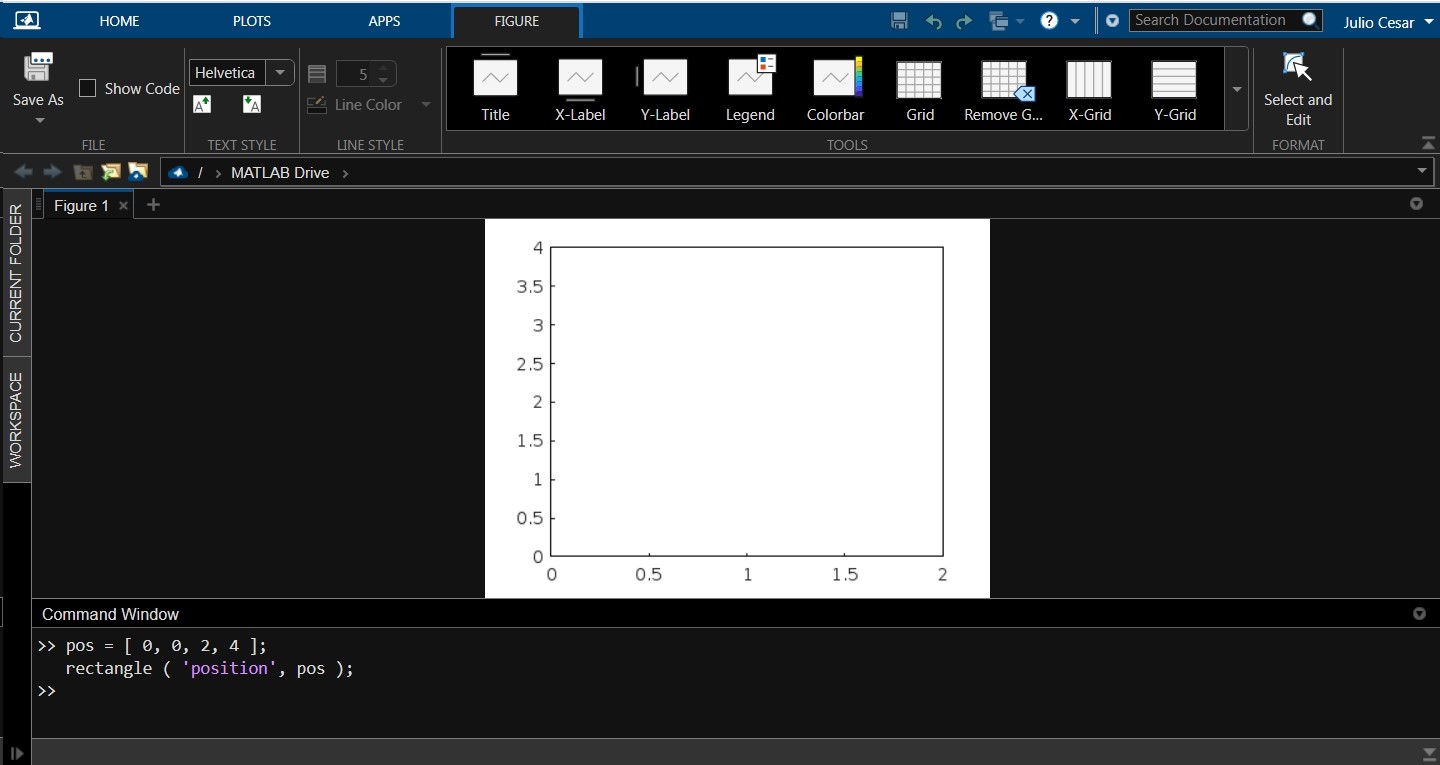
Now, we create a “pos” vector so that it draws a rectangle with coordinates x0, y0, with a size of 4 high by 2 wide. Then we call the rectangle() function by passing the bracketed flag “position” in the form string and the pos vector separated by commas as shown in the following image:
rectangle ( 'position', pos );
All other entries are empty in this case. So, the line style, angular curvature, etc., have their parameters by default.
How To Set the Curvature at the Vertices of the Rectangle With the “Curvature” and “Cur” Inputs of the MATLAB Rectangle Function
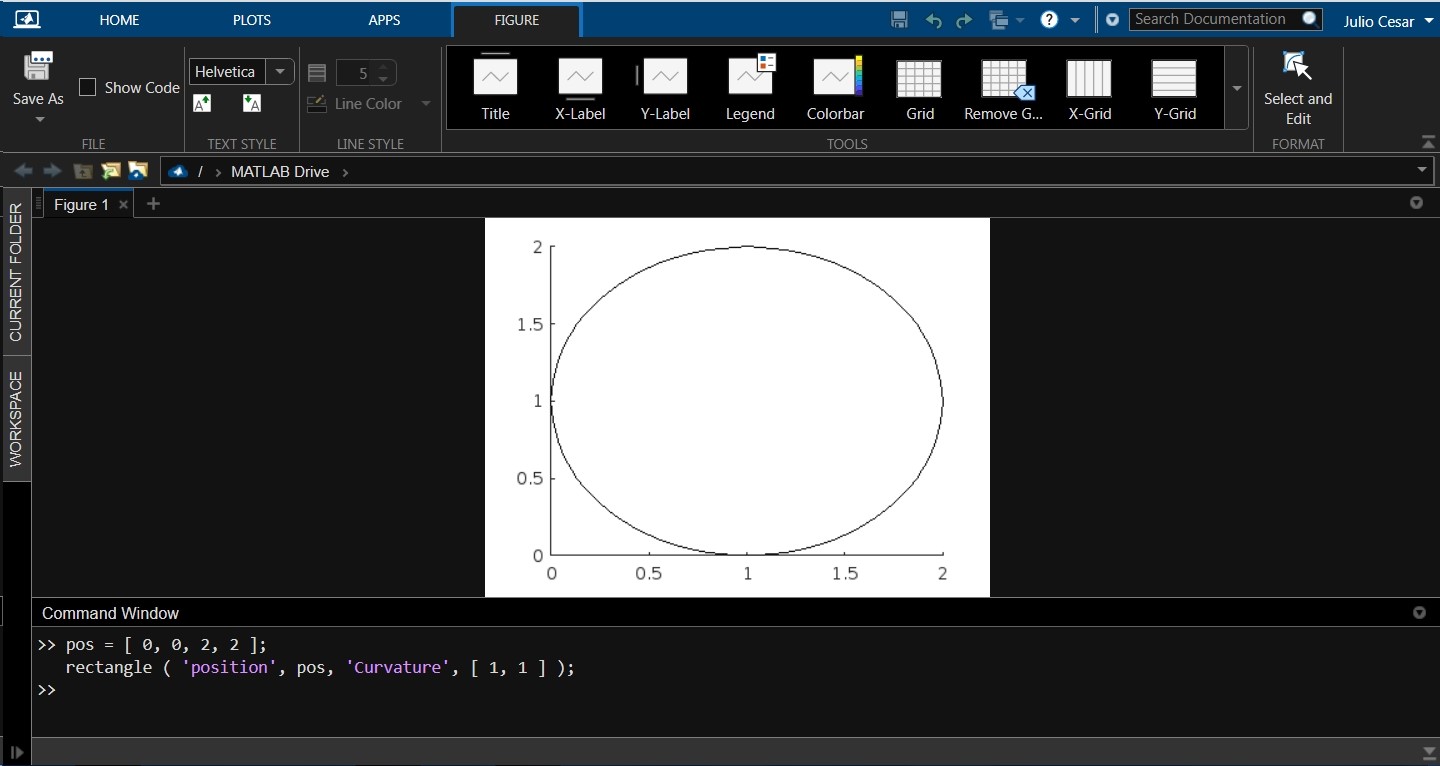
In this example, we use the inputs “curvature” and “cur” to specify the curvature of the corner in the rectangle we want to draw. The “cur” input argument is a two-element vector that specifies the horizontal and vertical curvature of the corner, respectively.
If the values of the elements of the “cur” vector =0, the curvature is zero, and if they have the value =1, the curvature is complete. In these cases, the rectangles become circles, as shown below:
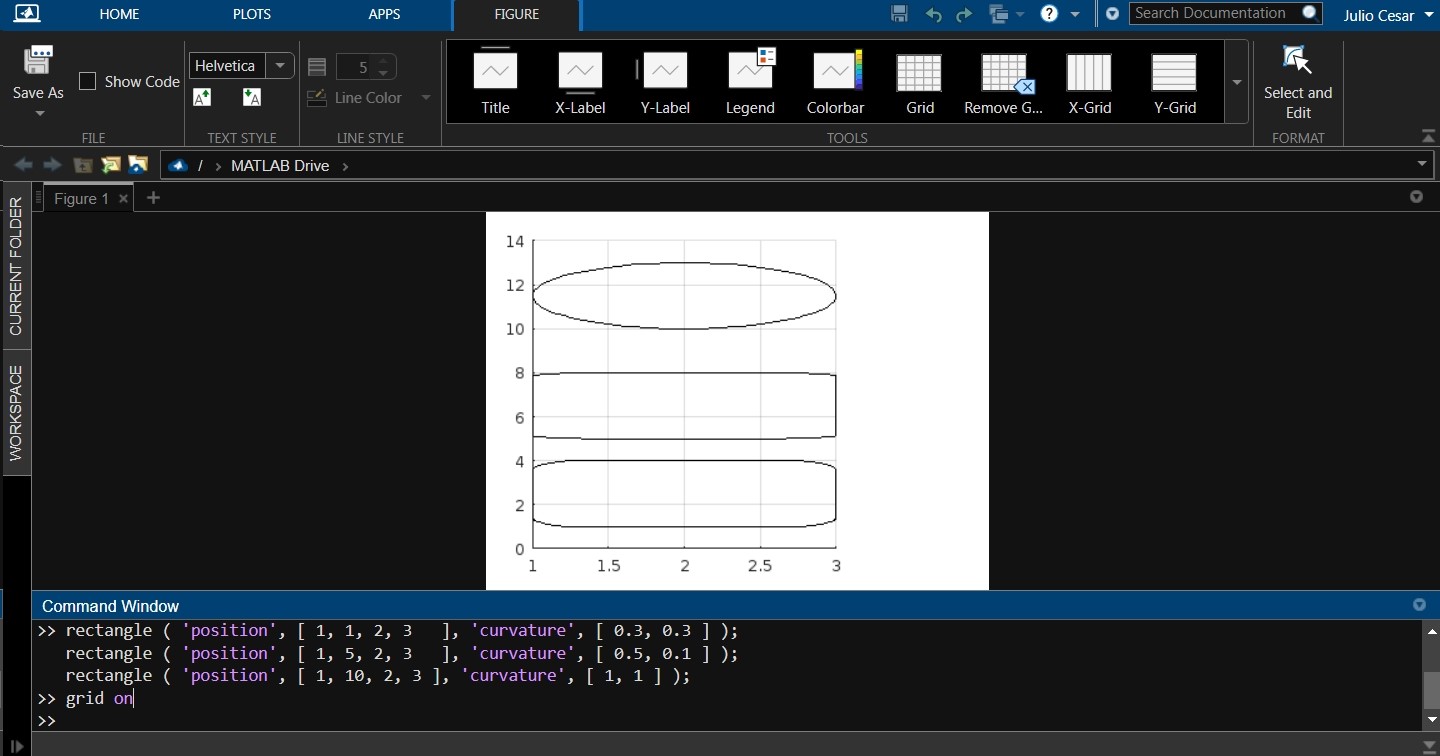
Now, we draw three curved rectangles. The first is a rectangle with horizontal and vertical curvature equal to 0.3. The second has a vertical curvature of 0.5 and a horizontal curvature of 0.1. The last is a square with a curvature of 1 horizontally and vertically, making it an oval.
rectangle ( ‘position’, [ 1, 5, 2, 3 ], ‘curvature’, [ 0.5, 0.1 ] );
rectangle ( ‘position’, [ 1, 10, 2, 3 ], ‘curvature’, [ 1, 1 ] );
grid on
As shown in the following image, we can control the curvature of the rectangle’s corners via the inputs for “curvature” and the parameters we enter in “cur”:
How To Select the Axes Where We Are Going To Draw Using the “Ax” Input of the MATLAB Rectangle Function
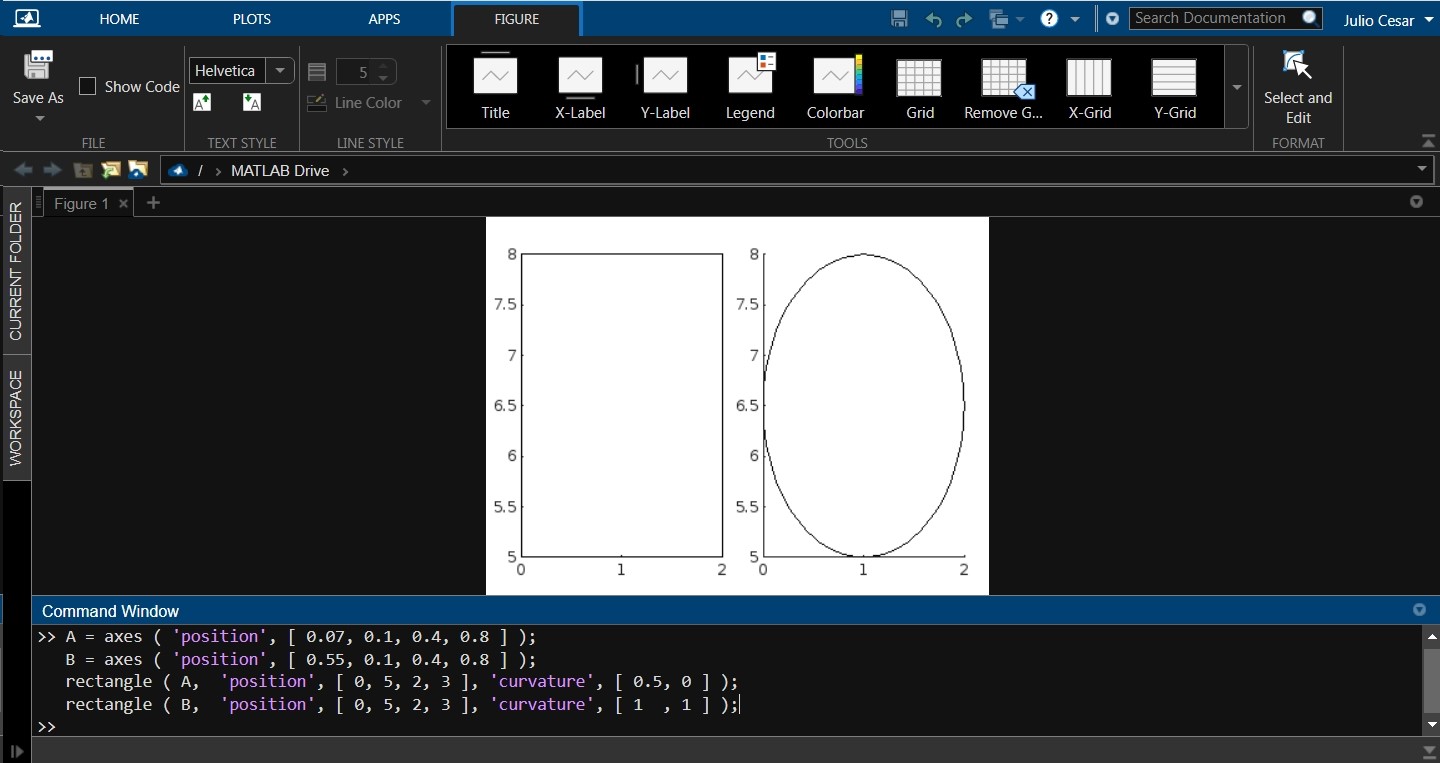
The rectangle function also allows us to select one of several axes to draw rectangles. This is done by specifying the name of the axis we want to draw at the “ax” input. Next, let’s see an example where we create 2 axes and draw a rectangle on A1 and an oval on A2:
A2 = axes ( 'position', [ 0.55, 0.1, 0.4, 0.8 ] );
rectangle ( A1, 'position', [ 0, 5, 2, 3 ], 'curvature', [ 0.5, 0 ] );
rectangle ( A2, 'position', [ 0, 5, 2, 3 ], 'curvature', [ 1 , 1 ] );
We see that it is possible to simply work with multiple axes. The following image shows the rectangle drawn on axis A1 and the oval on A2:
Conclusion
In this article, we have explained everything you need to know to draw rectangles on graphs in MATLAB using the rectangle function. We showed you the syntax, input arguments, and different ways to call this function. We have also developed some working examples with short code snippets that you can copy and paste into the MATLAB command line to familiarize yourself with using this function. We hope that this MATLAB article was helpful for you. See other Linux Hint articles for more tips and information on this powerful programming language for scientific computation.