What is MATLAB
MATLAB program created by MathWorks, is a programming language and numerical computing environment utilized for various computational tasks. It is used in engineering, science, and finance for data analysis, modeling, and simulation. MATLAB’s extensive library of built-in functions and toolboxes make it a versatile tool for a wide range of applications.
Getting Started with MATLAB
Before we can start plotting points in MATLAB, we need to have the software installed on the computer. We can download a trial version of MATLAB from the MathWorks website or purchase a license if we have plans to use it regularly. Once we have installed MATLAB, we can launch the program and begin exploring its features.
MATLAB Plotting Functions
MATLAB has several built-in functions for creating plots. The most used functions for plotting points are plot, scatter, and stem. Each of these functions has its own set of options and customization features that allow us to create a wide range of point plots.
Basic Plotting in MATLAB
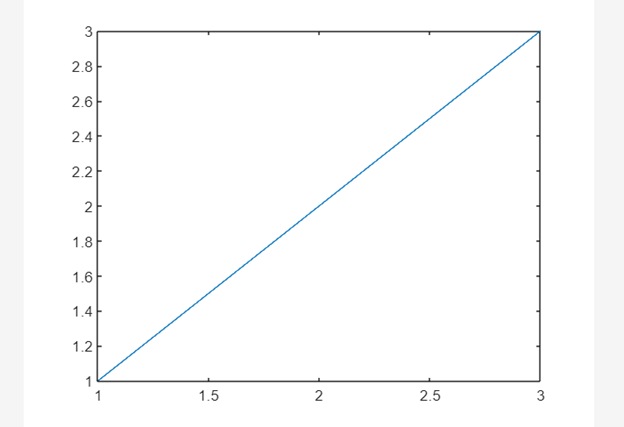
To create a basic point plot in MATLAB, we can use the plot function. This function takes two arguments. The two coordinates of a point are:
- x-coordinates
- y-coordinates
For example, to plot the points (1,1), (2,2), and (3,3), use the following code:
y = [1 2 3];
plot(x,y)
This will create a plot with the specified points connected by lines.
Plotting Points in 2D
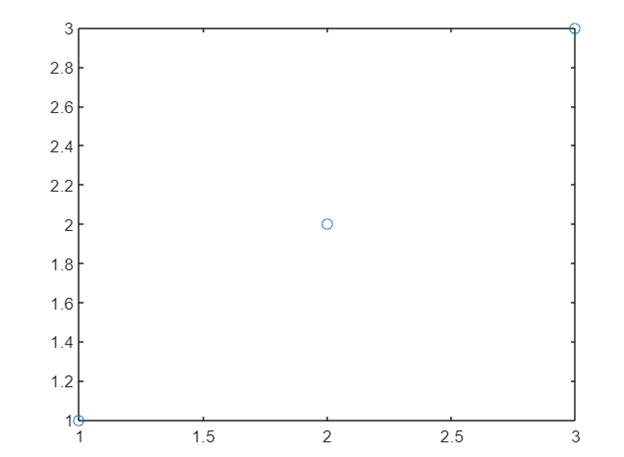
In addition to using the plot function to create line plots, we can also use it to create scatter plots by specifying the marker style.
Here is the given command we have created a create scatter plot of the above points:
y = [1 2 3];
plot(x,y,'o')
This will create a scatter plot with circular markers at each point.
Customizing Point Plots
MATLAB provides many options for customizing point plots. We can change the marker style in MATLAB.
Following is the list of changes we can do in any of the MATLAB plots:
- Size
- Color
- Add labels and titles
- Adjust the axis limits and tick marks
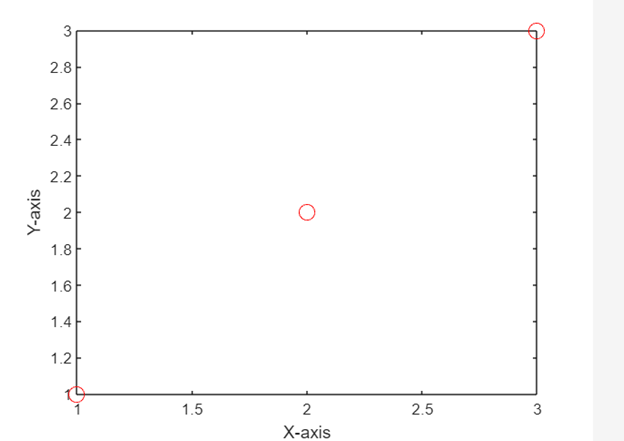
Now we will create a scatter plot with larger red markers and labeled axes:
y = [1 2 3];
plot(x,y,'or','MarkerSize',10)
xlabel('X-axis')
ylabel('Y-axis')
This will create a scatter plot with larger red circular markers and labeled x- and y-axes.
Plotting Points in 3D
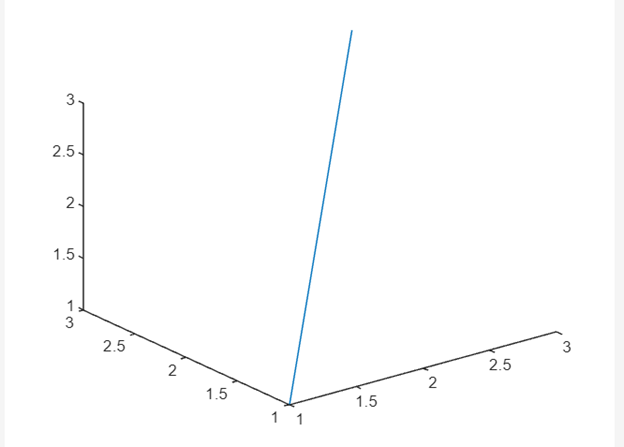
In addition to plotting points in two dimensions, we can also plot points in three dimensions using the plot3 function. This function works similarly to the plot function but takes three arguments: the x-, y-, and z-coordinates of the points we want to plot.
For example, to plot the points (1,1,1), (2,2,2), and (3,3,3) in three dimensions, use the following code:
y = [1 2 3];
z = [1 2 3];
plot3(x,y,z)
This will create a three-dimensional plot with specified points connected by lines.
Conclusion
Plotting points in MATLAB helps to visualize data. In MATLAB we have an extensive library of built-in functions and customization options, we can create a wide range of point plots to suit our needs. We can plot different points in two dimensions or three dimensions using MATLAB. Read the above article to cover all these ways of plotting a point in MATLAB.