Today, we are going to discuss the working of the loglog() function in MATLAB used to make log scale plots.
How to Plot a Log-log Scale Plot in MATLAB Using loglog() Function?
The Log-log scale plots can be created in MATLAB using the built-in loglog() function. This function allows us to create two-dimensional plots of a function or expression with a logarithmic scale (base 10) in MATLAB. This type of plot is mostly used to plot very large and very small positive values. You can also use this function to create the logarithmic plot for complex numbers by keeping the real entries on the x-axis and the imaginary entries on the y-axis.
Syntax
The loglog() function has the simple syntax in MATLAB that is given below:
loglog(X,Y,LineSpec)
loglog(Y)
loglog(Y,LineSpec)
Here:
The function loglog(X, Y) creates a logarithmic scale plot for the x and y coordinates, setting up the base 10 logarithmic scale on the x and y-axis.
- To plot a single set of data, X and Y should be vectors having equal length.
- To plot multiple data sets, one of both X or Y should be a matrix.
The function loglog(X, Y, LineSpec) creates the log scale plots using the line specifiers like marker size, color, and style.
The function loglog(Y) creates a log scale plot Y corresponding to the implicit set of x-coordinate.
- If Y is a vector the number of x-coordinates lies between 1 and length(Y).
- If Y is a matrix, the number of x-coordinates lies between 1 and the number of rows of Y.
The function loglog(Y, LineSpec) creates a log scale plot for Y using the line specifiers like marker size, color, and style.
Examples
Follow the given examples to learn how to plot log scale plots in MATLAB.
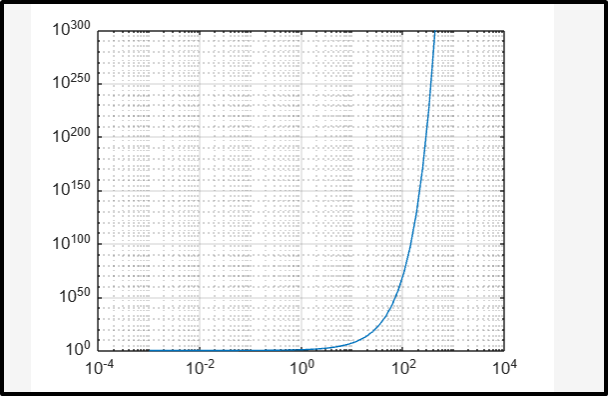
Example 1: Plot a Log-log Scale Plot Using loglog(X,Y)
This MATLAB code creates a log scale plot corresponding to X and Y vectors using the loglog(X, Y) function.
Y = 5.^x;
loglog(X,Y)
grid on
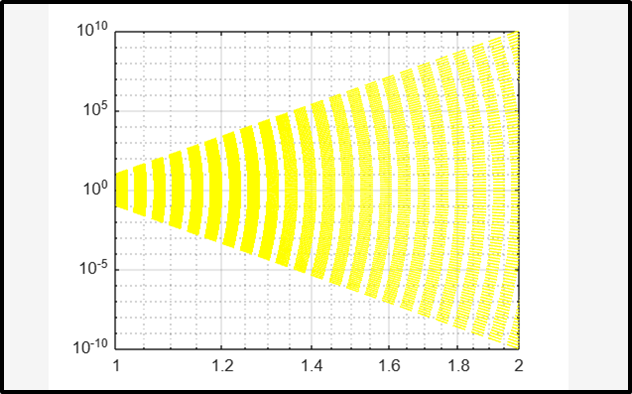
Example 2: Plot a Log-log Scale Plot Using loglog(Y, LineSpec)
The given example creates multiple log scale plots corresponding to the matrix Y using the loglog(Y, LineSpec) function.
loglog(Y, '--y')
grid on
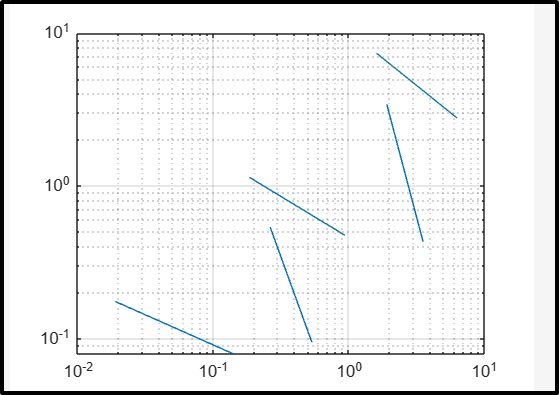
Example 3: Plot a Log-log Scale Plot Using loglog(Y)
In this example, we create a log scale plot for the complex numbers stored in the vector Y.
loglog(Y)
grid on
Conclusion
The loglog() is a useful function in MATLAB used for creating log scale plots. These plots are used for plotting the very large and very small positive small values. These plots can also plot the logarithmic values of the complex numbers by placing the real values on the x-axis and imaginary values on the y-axis. This guide provided us with useful information about the log scale plots. It also taught us how to create log scale plots in MATLAB using the loglog() function.