Understanding the distribution and frequency of data values is essential for data analysis tasks. MATLAB provides a simple way to create histograms, which visually represent data distributions. In MATLAB, histograms can be created to gain valuable insights from your data and facilitate informed decision-making. Whether you are a beginner or an experienced MATLAB user, this step-by-step guide will walk you through the process of plotting histograms in MATLAB.
How to Plot a Histogram in MATLAB
To plot a histogram in MATLAB, you must follow the below-given steps:
Step 1: Import or Generate Data
Before plotting a histogram, you must have the data to work with, and MATLAB offers multiple options to import existing data from files or databases.
Here, ‘filename’ represents the name of the file from which you want to import data, and you must make sure the file is in a format that MATLAB can recognize, such as a text file or a spreadsheet file.
You can also generate sample data directly within MATLAB using the various built-in functions. For example, to create an array of random numbers, you can use the rand function.
The syntax to generate data is given below:
In this example, n represents the desired number of data points. The rand function generates a 1-by-n array of random numbers between 0 and 1.
Step 2: Determine the Number of Bins
Bins are the intervals into which the range of data values is divided in a histogram. Selecting the appropriate number of bins is crucial to accurately depict the distribution of data. You can manually specify the number of bins based on your understanding of the data.
Step 3: Create the Histogram
Once you have your data and the desired number of bins, it’s time to create the histogram. MATLAB offers the hist or histogram function, which is the primary tool for histogram creation. Simply provide your data as input to the hist function and specify the number of bins.
The syntax is as follows:
Or:
Here, data represents the data you want to plot a histogram of, and numBins specifies the desired number of bins.
Step 4: Customize the Histogram
MATLAB allows you to customize various aspects of the histogram to enhance its appearance and readability. You can modify axis labels to provide clear descriptions of the data being plotted. Adjusting bin widths can help reveal more detailed patterns in the data. Changing colors and adding titles can make the histogram visually appealing and informative.
For example, to add x and y labels, use the following code:
ylabel('Frequency')
To adjust bin widths, you can use the following code:
Using the ‘BinWidth’ parameter, you can specify the desired width of the bins in your histogram. Replace data with your input data and binWidth_value with the desired width value.
If you want to change the histogram colors, follow the below-given code:
With the ‘FaceColor’ parameter, you can specify the color of the histogram bars. Replace ‘color’ with the desired color name or RGB value.
You can also add a title for the histogram from the below-given syntax:
To save the histogram plot, you can use the following function.
print('-dpng', 'myfigure.png');
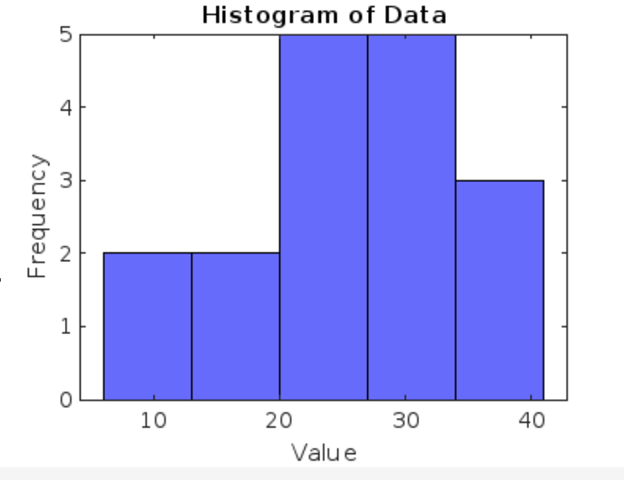
The complete code to plot a histogram in MATLAB is given below:
data = [10, 12, 15, 18, 20, 22, 22, 22, 25, 28, 30, 30, 30, 32, 35, 38, 40];
% Step 2: Set the number of bins
numBins = 5;
% Step 3 and Step 4: Create and customize the histogram
histogram(data, numBins,'FaceColor', 'blue');
xlabel('Value');
ylabel('Frequency');
title('Histogram of Data');
% Print the figure as a PNG file
print('-dpng', 'myfigure.png');
Conclusion
MATLAB offers a user-friendly and powerful platform for plotting histograms that can be done through hist or histogram functions. By following the step-by-step guide in this article, you will learn how to import or generate data, determine the number of bins, create, and customize histograms, analyze the results, and customize it according to your choice.