In this blog, we will first learn the steps to plot a function with 2 variables in MATLAB, then we will provide functions that can be used to plot a function with 2 variables with examples to help us understand the concept.
How to Plot a Function Having Two Variables in MATLAB?
Before moving towards the methods for plotting a function with 2 variables in MATLAB, we must learn how to plot such a function in MATLAB using the commonly used meshgrid() function. See the step-by-step guide below:
Step 1: Initialize two vectors as the domain of the two independent variables of the given function.
Step 2: Calculate the values of the dependent variable by putting the values of independent variables in the given function.
Step 3: Apply the meshgrid() function to get a grid of (x,y) coordinates.
Step 4: Plot the resultant values using MATLAB’s built-in function.
We can plot a function with two variables in MATLAB:
1: How to Plot a Function Having 2 Variables in MATLAB Using mesh() Function?
A function with 2 variables can be plotted in MATLAB using the mesh plots. A mesh plot is a 3D plot that allows us to plot a function of the form z=f(x, y) where z behaves like the dependent variable while x as well as y behave like independent variables. This kind of plot can be plotted using MATLAB’s mesh() built-in function.
Example
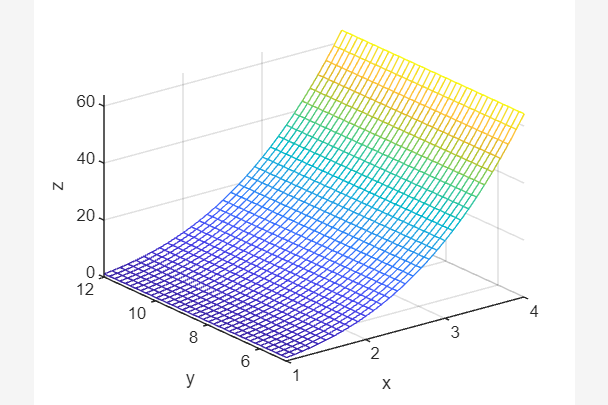
The given example uses the mesh() function to plot a function with two variables in MATLAB.
Y = [5:0.2:12];
[X,Y] = meshgrid(X,Y);
Z = X.^3 - 1./Y.^2;
mesh(X, Y, Z);
xlabel('x');
ylabel('y');
zlabel('z');
For more detail, follow this What is Mesh Plot in MATLAB.
2: How to Plot a Function with 2 Variables in MATLAB Using surf() Function?
We can plot a function having 2 variables in MATLAB using the surface plots. The surface plot is a 3-D plot that enables us to plot a function of the form z=f(x, y) having solid face and edge colors. Here z is the dependent variable and x and y are independent variables. This kind of plot can be plotted using MATLAB’s built-in surf() function.
Example
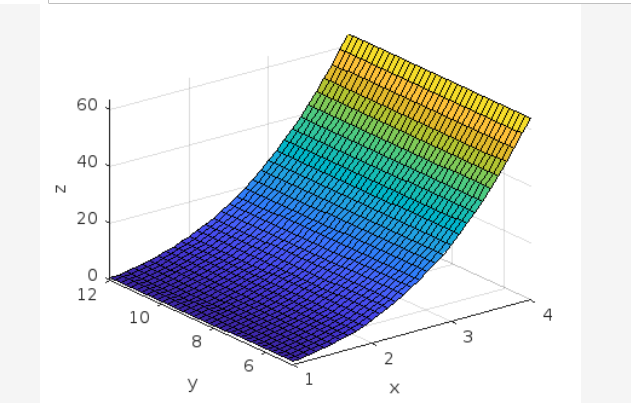
In this example, we draw a surface plot of a function having two variables using the surf() function in MATLAB.
Y = [5:0.2:12];
[X,Y] = meshgrid(X,Y);
Z = X.^3 - 1./Y.^2;
surf(X, Y, Z);
xlabel('x');
ylabel('y');
zlabel('z');
Read the guide Create Surface Plot Using surf() Function in MATLAB for more details.
3: How to Plot a Function with 2 Variables in MATLAB Using ezsurf() Function?
The ezsurf() is a built-in function in MATLAB used for plotting colored surface plots. These plots can graph both real and complex-valued functions. Unlike the surf() and mesh() plots, the ezsurf() plots do not require creating a meshgrid. These plots simply accept the function which we want to plot as an argument and create a colored surface plot for the by default domain [-2*pi, 2*pi]. You can also create the ezsurf plots over the specified range.
Example
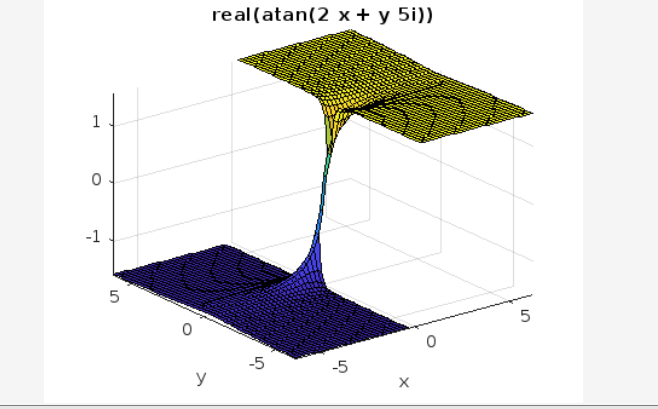
In the given example, we draw a surface plot of a function having two variables using the ezsurf() function in MATLAB.
f(x,y) = real(atan(2*x + 5*i*y));
ezsurf(f)
Conclusion
MATLAB is a beneficial programming language that is widely used for plotting different functions of different types. Plotting a function with two variables is an important task that can be performed using MATLAB’s built-in mesh(), surf() and ezsurf() functions. This tutorial went through the steps to plot a function having 2 variables in MATLAB using some examples.