An Empirical Cumulative Distribution Function plot is a statistical plot widely used to perform the comparison between multiple data sets having the same characteristics. This plot is also called the Empirical CDF or ECDF plot. MATLAB allows us to create this plot using the cdfplot() function.
This article is going to explore:
What is an Empirical CDF Plot?
Why do we Need an Empirical CDF Plot?
How to Create an Empirical CDF Plot in MATLAB?
- Example 1: How to Create an Empirical CDF Plot in MATLAB?
- Example 2: How to Create an Empirical Cumulative Distribution Function Plot With an Object Handle in MATLAB?
- Example 3: How to Compare Empirical CDF to Theoretical CDF Using cdfplot() Function in MATLAB?
What is an Empirical CDF Plot?
An Empirical CDF plot is a data visualization that displays our sample data set points from lowest to highest against their percentile values. This plot needs continuous variables and calculates percentiles and other distribution properties.
Why do we Need an Empirical CDF Plot?
An Empirical CDF plot has many uses but some of its main uses are listed below.
This plot is used:
- to measure the same characteristics of multiple data sets.
- for identifying the point where most values occur.
- to find percentiles and properties of a data set.
- to identify how your data follows a best-fitted distribution.
- for assessing your data range.
How to Create an Empirical CDF Plot in MATLAB?
An Empirical CDF plot can be easily and efficiently created in MATLAB using the built-in cdfplot() function. This function accepts sample data in the form of a row or column vector as a mandatory parameter and creates an Empirical CDF plot against that data set.
Syntax
The cdfplot() function can be implemented in the following ways.
h = cdfplot(x)
Here,
The function cdfplot(x) is responsible for creating the Empirical CDF plots for the given sample data x. Keep in mind that x must be a row or column vector.
The function h=cdfplot(x) is responsible for creating a handle h of the Empirical CDF plot line object. The handle h can be used for querying or modifying the properties of the object after creating it.
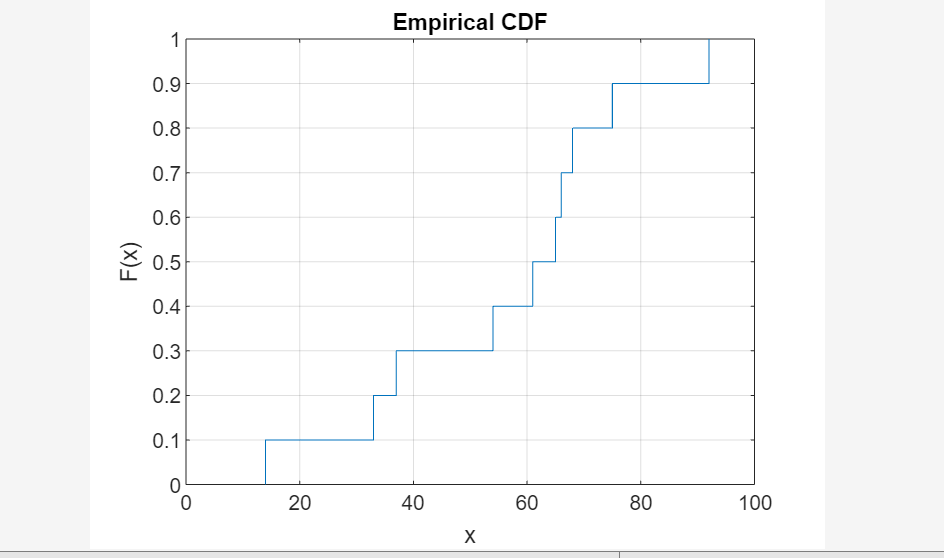
Example 1: How to Create an Empirical CDF Plot in MATLAB?
This MATLAB code creates a column vector x of length 10 containing randomly distributed integers lying between 1 and 10. After that, it uses the cdfplot() function to create an Empirical CDF plot that can be seen from the given output.
cdfplot(x);
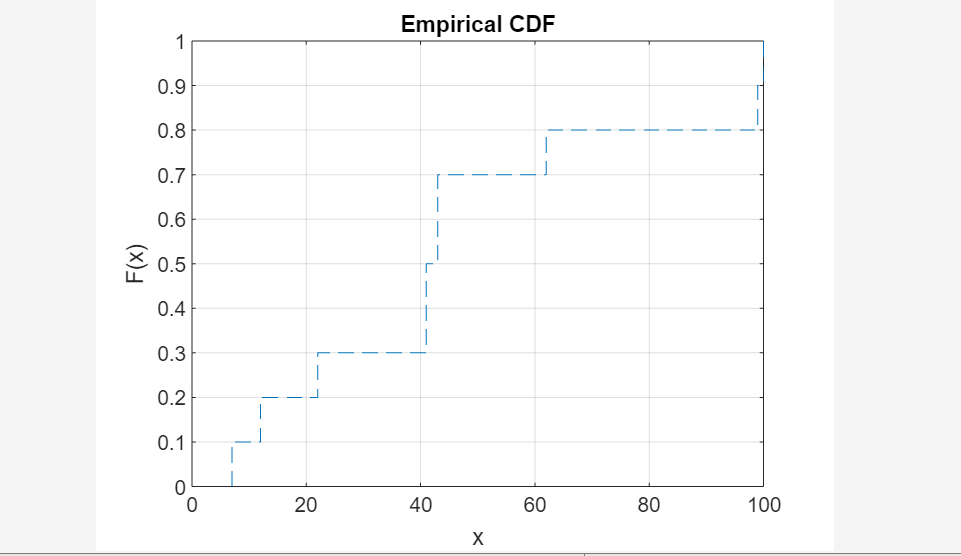
Example 2: How to Create an Empirical Cumulative Distribution Function Plot With an Object Handle in MATLAB?
This is another version of Example 1 in which we use the same input sample data x to create an Empirical CDF plot along its object handle h using h=cdfplot(x). After that, we use the handle h to change the line style from solid to “–” using the dot (.) notation. The obtained output can be observed from the given screenshot.
h = cdfplot(x);
h.LineStyle="--"
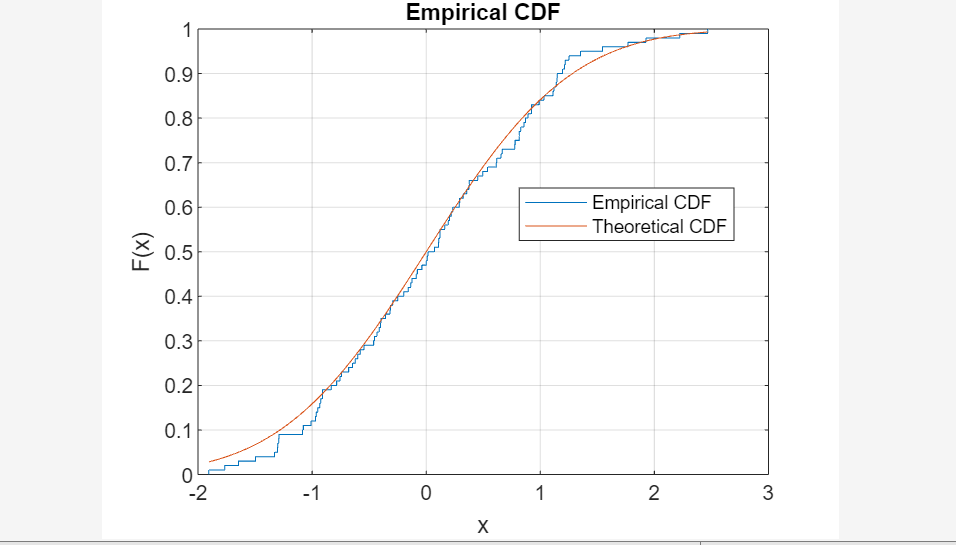
Example 3: How to Compare Empirical CDF to Theoretical CDF Using cdfplot() Function in MATLAB?
In this MATLAB code, we implement the cdfplot() function to perform a comparison of the theoretical CDF with the Empirical CDF. To perform this comparison, we initialize a row vector y containing 100 normally distributed random numbers and create an Empirical CDF plot.
After that, we initialize another data set x having the same length as y containing numbers lying between min(y) and max(y). Then we compute the theoretical cdf x1 for the data set x and plot it against the values of data set x using the plot() function. We use hold on and hold off commands to create both plots on the same figure to observe the similarity between Empirical CDF and theoretical CDF.
Conclusion
An Empirical CDF plot is a statistical technique widely used to compare multiple datasets having the same characteristics. We can create this plot in MATLAB using the built-in cdfplot() function accepting an observed sample data set in the form of a row or column vector. This tutorial explained what is an Empirical CDF plot and how to create it in MATLAB using the cdfplot() function.