What are Complex Numbers
Complex numbers in mathematics contain two parts, real and imaginary. The imaginary part is denoted by the letter i and is defined as the square root of -1. To write complex numbers a + bi notation is used. Here a corresponds to real and b is equal to the imaginary number.
Plotting Complex Numbers in MATLAB
In MATLAB we have numerous ways to plot a complex number. This article covers common ways of plotting a complex number in MATLAB.
To plot complex numbers, a plot function is used. The syntax of plot() is:
Where x and y are the real and imaginary parts of the complex numbers, respectively, and options are a list of optional parameters, such as plot color and size.
Now follow the given steps to plot complex numbers in MATLAB.
Step 1: Defining Complex Numbers in MATLAB
The first step in plotting complex numbers in MATLAB is to define the complex numbers that we want to plot. To define complex numbers, the complex() function is used.
The below code defines a new complex number with a (real number) equal to 3 and b (imaginary number) is 4:
Or we can also define the complex number directly as below:
Step 2: Using the plot() Function
Using plot() in MATLAB is one of the common ways of plotting numbers. The plot() function contains three arguments:
- The real part of a complex number
- The imaginary part of a complex number
- Optional parameters such as point color
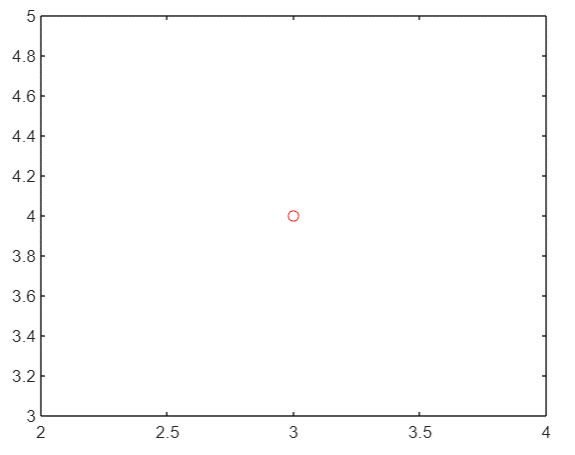
Now we will plot the above-defined complex number using the plot() function:
plot(real(z), imag(z), 'ro')
Or:
plot(real(z), imag(z), 'ro')
A new plot will open in a window with a single point at (3,4).
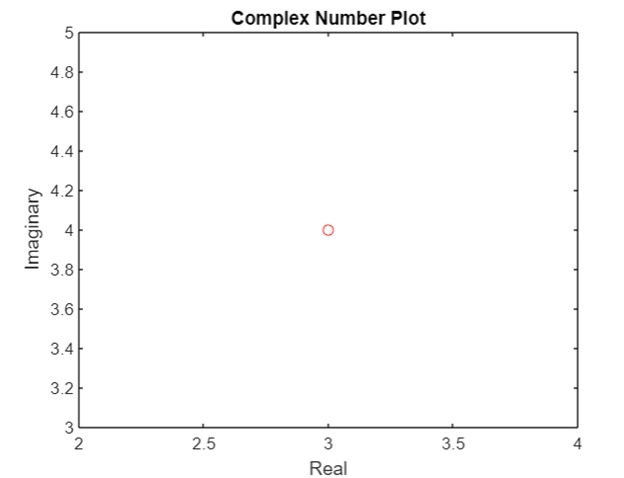
Step 3: Customizing the Plot
We can also customize a plot by adding labels, and titles, and changing the marker style. The below-mentioned code adds axis labels and a title to the above plot:
plot(real(z),imag(z))
xlabel('Real')
ylabel('Imaginary')
title('Complex Number Plot')
We can also change the marker style by specifying a third argument in the plot() function. Following the code add a red circle as a marker for the above plot of complex numbers:
plot(real(z),imag(z),'ro')
xlabel('Real')
ylabel('Imaginary')
title('Complex Number Plot')
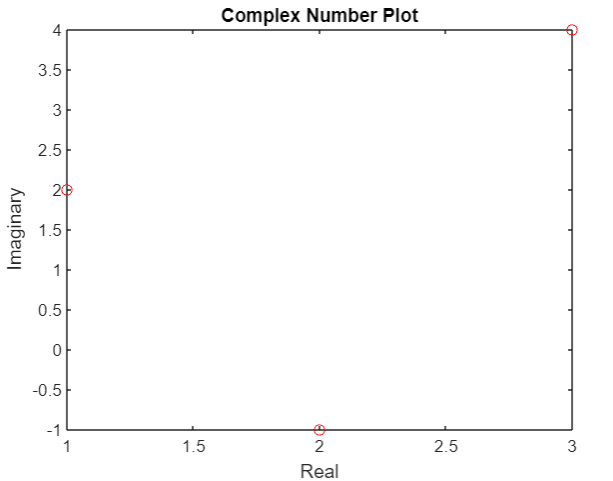
Step 4: Adding Multiple Complex Numbers to the Plot
We can also add multiple complex numbers to a single plot by defining them as a vector and passing them as arguments to the plot() function.
Here in the below-given code, we have defined three complex numbers denoted by z, z1, and z2:
z1 = complex(1,2);
z2 = complex(2,-1);
plot([real(z) real(z1) real(z2)],[imag(z) imag(z1) imag(z2)],'ro')
xlabel('Real')
ylabel('Imaginary')
title('Complex Number Plot')
Alternatively, we can also directly define the complex number as follows:
plot(real(z), imag(z), 'ro')
xlabel('Real')
ylabel('Imaginary')
title('Complex Number Plot')
This will create a plot with three points at (3,4), (1,2), and (2,-1).
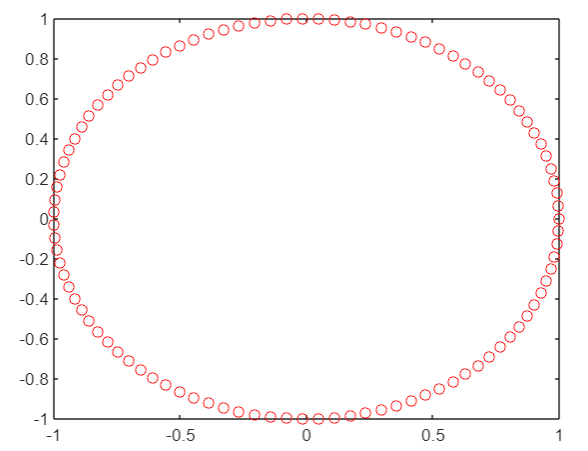
Step 5: Plot Complex Functions
We can also use plot() in MATLAB to plot complex functions.
For example, to plot the function z = exp(i*x), run following code:
z = exp(1i*x);
plot(real(z), imag(z), 'ro')
This would produce the following plot:
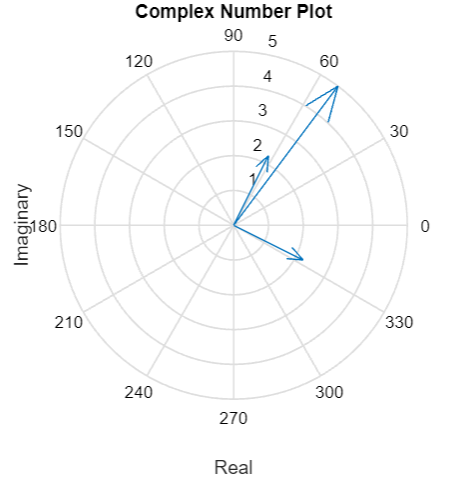
Step 6: Using the compass() Function
The compass() function creates a polar plot of complex numbers. The angle of each arrow corresponds to the phase of each complex number and its length corresponds to its magnitude.
Below given code will create a polar plot of our three complex numbers using compass():
z1 = complex(1,2);
z2 = complex(2,-1);
compass([z z1 z2])
xlabel('Real')
ylabel('Imaginary')
title('Complex Number Plot')
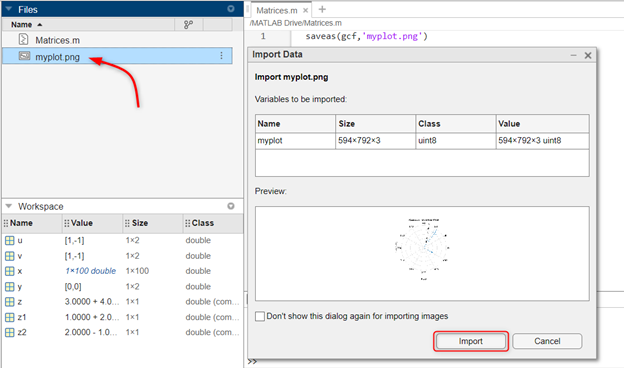
Step 7: Saving and Exporting Plot
After plotting the desired plot, we may want to save it or export it for further use. We can do this using various functions such as saveas(), print(), or exportgraphics().
To save the above plot as a PNG file named “myplot.png”, run the below code:
Conclusion
MATLAB is a programming environment that helps in plotting different data. We can perform mathematical calculations and plot it over the MATLAB screen using the plot() function. Similarly, MATLAB also allows users to perform the plotting of complex() numbers using the MATLAB function. This article covers several ways of plotting complex numbers and customizing our plot by defining the x and y labels along with the title for the graph.