A Pivot Table is a powerful tool for estimating, compiling, and reviewing data to find patterns and trends even easier. Pivot Tables can be used to aggregate, sort, arrange, rearrange, group, total, or average data in a dataset to truly comprehend data associations and dependencies. Using a pivot table as an illustration is the easiest way to demonstrate how this method operates. PostgreSQL 8.3 was launched a few years back, and a new version named ‘tablefunc’ was added. Tablefunc is a component that contains several methods that yield tables (that is, multiple rows). This modification comes with a very cool range of features. The crosstab method, which will be used to create pivot tables, is among them. The crosstab method takes a textual argument: a SQL command that returns raw data in the first layout and returns a table in the subsequent layout.
Example Pivot Table Without TableFunc:
To start working on the PostgreSQL pivoting with the ‘tablefunc’ module, you have to try to make a pivot table without it. So let’s open the PostgreSQL command-line shell and provide the parameter values for the required server, database, port number, username, and password. Leave these parameters empty if you want to use the default selected parameters.

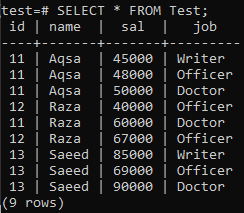
We will be creating a new table named ‘Test’ in the database ‘test’ with some fields in it, as displayed below.
![]()
After creating a table, it’s time to insert some values in the table, as shown from the below query.

You can see that the relevant data has been successfully inserted. You can see this table has more than 1 of the same values for id, name, and job.
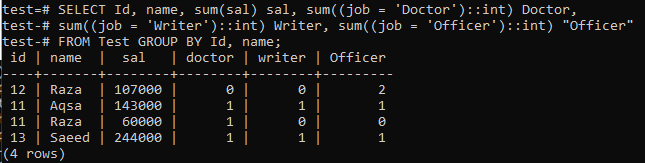
Let’s create a pivot table, which will summarize the record of the table ‘Test’ using the below query. The command merges the same values of the ‘Id’ and ‘name’ column in one row while taking the sum of ‘salary’ column values for the same data according to ‘Id’ and ‘name’. It’s also telling how many times one value has occurred in the particular set of values.
Example Pivot Table With TableFunc:
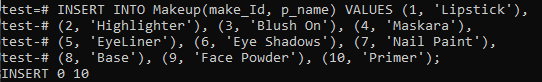
We’ll start by explaining our main point from a realistic standpoint, and then we’ll describe the pivot table creation in steps we like. So, first of all, you have to add three tables to work on a pivot. The first table we are going to create is ‘Makeup’, which will store information regarding makeup essentials. Try the below query in the command-line shell to create this table.
![]()
After the creation of table ‘Makeup’, let’s add some records to it. We will be executing the below-listed query in the shell to add 10 records to this table.
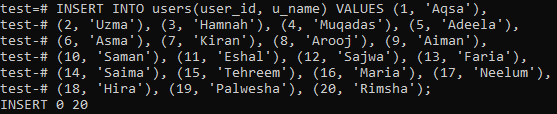
We need to create another table named ‘users’ which is going to hold the records of the users using those products. Execute the below-stated query in the shell to create this table.
![]()
We have inserted the 20 records for the table ‘users’ as shown in the image below.
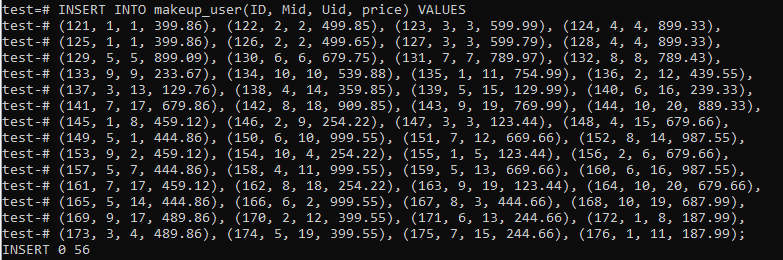
We have another table, ‘makeup_user’, which will hold the mutual records of both the ‘Makeup’ and ‘users’ table. It has another field, ‘price’, which will save the price of the product. The table has been generated by using the stated below query.

We have inserted a total of 56 records in this table, as shown in the picture.
Let’s create a view further to use it for the generation of a pivot table. This view is using INNER Join to match the primary key column values of all the three tables and fetch the ‘name’, ‘product_name’, and the ‘cost’ of a product from a table ‘customers’

To use this, you must have to first install the tablefunc package for the database you want to use. This package is built-in PostgreSQL 9.1 and later released by running the below-stated command. The tablefunc package has been enabled for you now.
![]()
After creating the extension, it’s time to use the Crosstab() function to create a pivot table. So we will be using the following query in the command-line shell to do so. This query is first fetching the record from the newly created ‘View’. These records will be ordered and grouped by the ascending order of columns ‘u_name’ and ‘p_name’. We have listed their makeup name for every customer, which they have purchased, and the total cost of products purchased in the table. We have applied the UNION ALL operator on the column ‘p_name’ to sum-up all the products purchased by one customer separately. This will sum-up all the costs of products purchased by a user into one value.
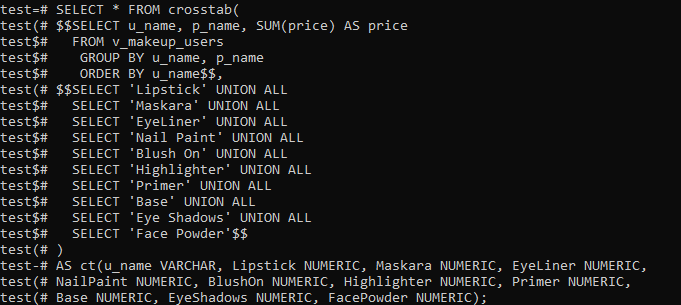
Our Pivot table has been ready and displayed in the image. You can clearly see that some column spaces are empty below every p_name because they have not purchased that particular product.

Conclusion:
We have now brilliantly learned how to create a pivot table to summarize the tables’ results with and without the use of the Tablefunc package.