A very common requirement of the business website is creating a chart based on the collected data of the website to find out different types of statistical information of the target users and the current progress of the business. This information helps to grow the business faster. So, the web programmer must gain basic knowledge of creating the chart. The chart can be generated by server-side and client-side scripts. The developer can select any type of script based on website requirements. There are some advantages and disadvantages of using the server-side and client-side charts. The chart generated by the server-side script increases the server overload that makes the site slower. The end users may lose their patience when the chart images need more time to download. This problem of creating a chart on the website can be omitted by using the client-side chart. The chart is generated locally by fetching XML or JSON data from the server in a client-side script. The chart created by client-side script makes the download faster, and various customized charts can be created, such as applying animation in the chart and making the chart attractive. In this tutorial, you will learn to create the chart using the server-side PHP library.
Server-Side Chart:
Many free and commercial server-side PHP chart libraries are available now. pChart, PHPChartJS, FusionCharts, JpGraph, etc. are PHP libraries to create a server-side chart on the web page. Using the JpGraph library has been explained in this tutorial by creating different types of charts. The free version of the JpGraph library has been used in this tutorial.
JpGraph:
It is an object-oriented-based chart library that creates different types of charts, such as line charts, bar charts, and pie charts. It is available in free and paid versions. The paid version is used for commercial purposes and can create a bar code or QR code. You have to download the JpGraph library before using it. Go to the following URL address and download the library:
After downloading the library, unzip the file and store it in the folder where the PHP script will be executed. I have stored folder inside /var/www/html/phpcode folder. Creating different types of charts using this library will be shown in the following part of this tutorial.
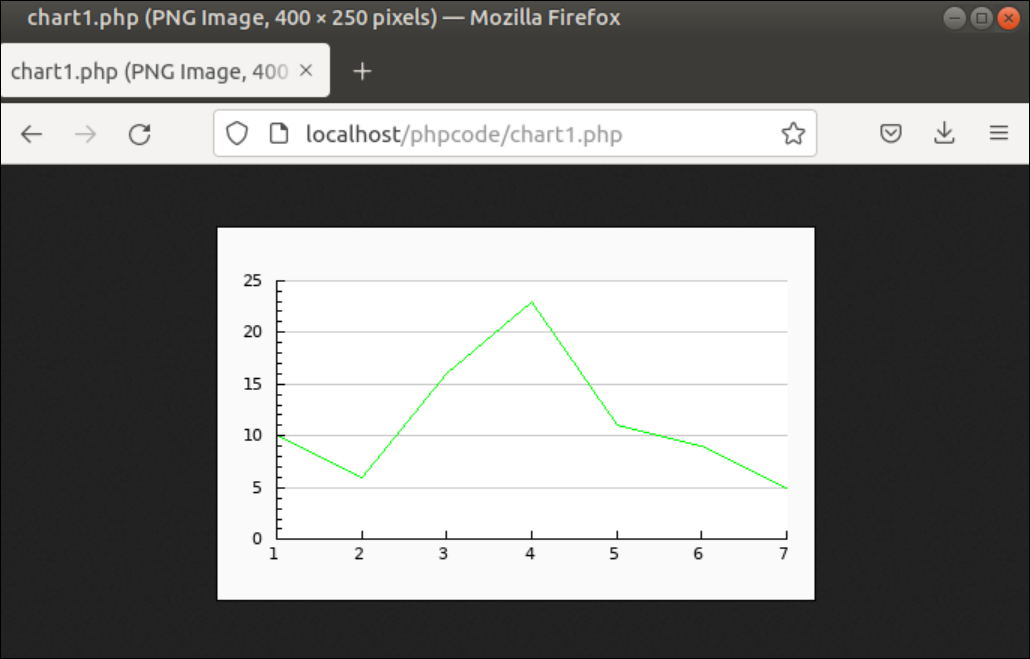
Example 1: Creating Line Chart
Create a PHP file with the following script to draw a line chart of green color. An array has been used to set the data for drawing the chart. The Graph object has been used for displaying the chart, and the LinePlot object has been used to create the line chart by using the Graph object.
//Include necessary files to draw line chart
require_once ('jpgraph-4.3.5/src/jpgraph.php');
require_once ('jpgraph-4.3.5/src/jpgraph_line.php');
//Set the data
$data = array(10,6,16,23,11,9,5);
//Declare the graph object
$graph = new Graph(400,250);
//Clear all
$graph->ClearTheme();
//Set the scale
$graph->SetScale('textlin');
//Set the linear plot
$linept=new LinePlot($data);
//Set the line color
$linept->SetColor('green');
//Add the plot to create the chart
$graph->Add($linept);
//Display the chart
$graph->Stroke();
?>
Output:
The following output will appear after executing the script from the server:
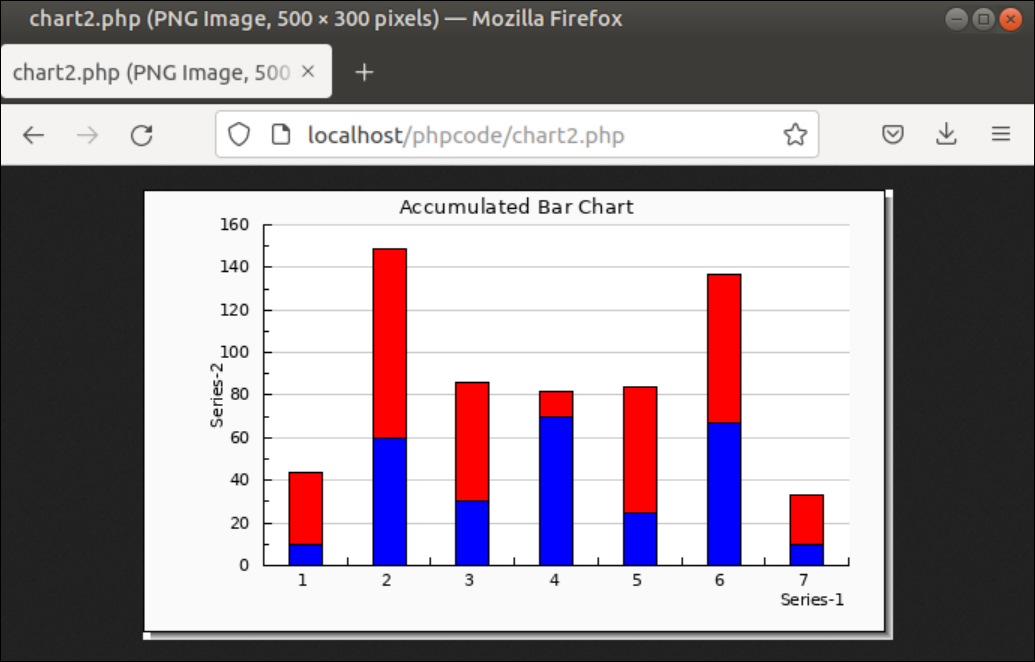
Example 2: Creating an Accumulated Bar Chart
Create a PHP file with the following script to draw an accumulated bar chart. Two arrays have been used to set the data for drawing the chart. The Graph object has been used for displaying the chart. The BarPlot and AccBarPlot objects have been used to create the accumulated bar chart using the Graph object.
//Include necessary files to draw bar chart
require_once ('jpgraph-4.3.5/src/jpgraph.php');
require_once ('jpgraph-4.3.5/src/jpgraph_bar.php');
//Set the data
$series1=array(10,60,30,70,25,67,10);
$series2=array(34,89,56,12,59,70,23);
//Declare object to draw the chart
$graph = new Graph(500,300);
//Clear all
$graph->ClearTheme();
//Set some setting for the chart
$graph->SetScale("textlin");
$graph->SetShadow();
$graph->img->SetMargin(80,30,20,50);
//Create object and colors for the bar plots
$b1plot = new BarPlot($series1);
$b1plot->SetFillColor("blue");
$b2plot = new BarPlot($series2);
$b2plot->SetFillColor("red");
//Create object for the grouped bar plot
$gbplot = new AccBarPlot(array($b1plot, $b2plot));
//Add the plot for the chart
$graph->Add($gbplot);
//Set title of the chart, x-axis and y-axis
$graph->title->Set("Accumulated Bar Chart");
$graph->xaxis->title->Set("Series-1");
$graph->yaxis->title->Set("Series-2");
//Display the graph
$graph->Stroke();
?>
?>
Output:
The following output will appear after executing the script from the server:
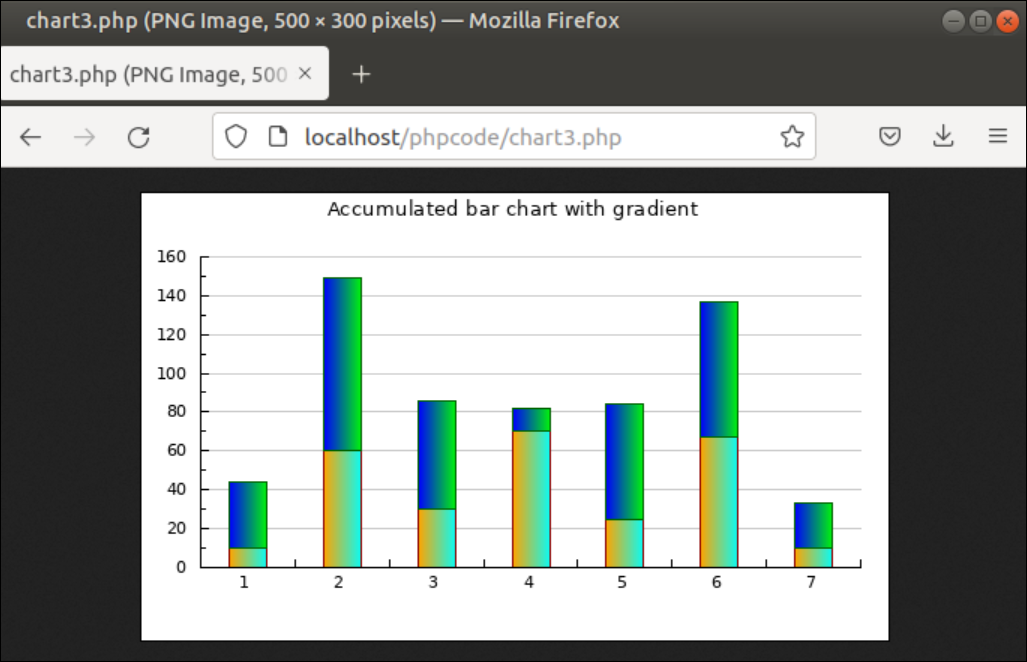
Example 3: Creating Accumulated Bar Chart With Gradient
Create a PHP file with the following script to draw an accumulated bar chart with a gradient. Two arrays have been used to set the data for drawing the chart. The Graph object has been used for displaying the chart. The BarPlot and AccBarPlot objects have been used to create the accumulated bar chart using the Graph object. The SetFillGradient() function of the BarPlot object has been used in the script to set the gradient color of the chart.
//Include necessary files to draw line chart
require_once ('jpgraph-4.3.5/src/jpgraph.php');
require_once ('jpgraph-4.3.5/src/jpgraph_bar.php');
//Set the data
$series1=array(10,60,30,70,25,67,10);
$series2=array(34,89,56,12,59,70,23);
//Declare object to draw the chart
$graph = new Graph(500,300);
//Clear all
$graph->ClearTheme();
//Set some setting for the chart
$graph->SetScale('textlin');
$graph->SetMarginColor('white');
$graph->title->Set('Accumulated bar chart with gradient');
//Create the first bar
$plot1 = new BarPlot($series1);
$plot1->SetFillGradient('orange','cyan',GRAD_VERT);
$plot1->SetColor('darkred');
// Create the second bar
$plot2 = new BarPlot($series2);
$plot2->SetFillGradient('blue','green',GRAD_VERT);
$plot2->SetColor('darkgreen');
//And join them in an accumulated bar
$gaccplot = new AccBarPlot([$plot1,$plot2]);
$graph->Add($gaccplot);
// Display the graph
$graph->Stroke();
?>
Output:
The following output will appear after executing the script from the server:
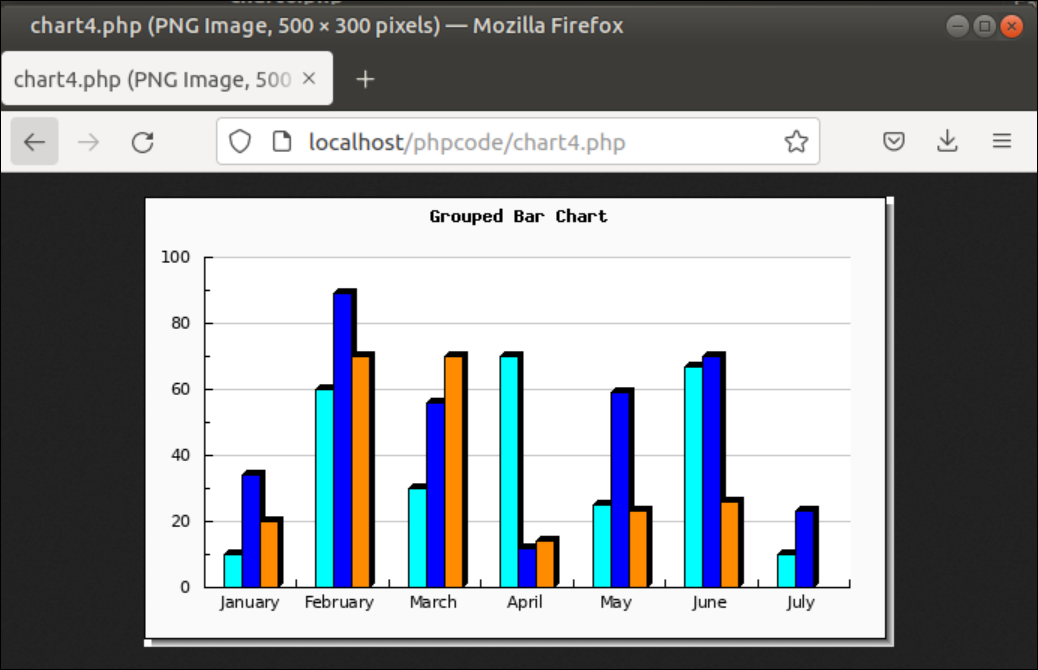
Example 4: Creating a Grouped Bar Chart
Create a PHP file with the following script to draw a grouped bar chart. Three arrays have been used to set the data for drawing the chart. The Graph object has been used for displaying the chart. The BarPlot and GroupBarPlot objects have been used to create the grouped bar chart by using the Graph object.
//Include necessary files to draw line chart
require_once ('jpgraph-4.3.5/src/jpgraph.php');
require_once ('jpgraph-4.3.5/src/jpgraph_bar.php');
//Set the data series
$series1=array(10,60,30,70,25,67,10);
$series2=array(34,89,56,12,59,70,23);
$series3=array(20,70,70,14,23,26);
//Declare object to draw the chart
$graph = new Graph(500, 300);
//Clear all
$graph->ClearTheme();
//Set some setting for the chart
$graph->SetScale("textlin");
$graph->SetShadow();
$graph->img->SetMargin(40,30,40,40);
$graph->xaxis->SetTickLabels($gDateLocale->GetMonth());
$graph->xaxis->title->SetFont(FF_FONT1,FS_BOLD);
$graph->title->Set('Grouped Bar Chart');
$graph->title->SetFont(FF_FONT1,FS_BOLD);
//Create plot objects
$plot1 = new BarPlot($series1);
$plot2 = new BarPlot($series2);
$plot3 = new BarPlot($series3);
//Set some setting for the plot
$plot1->SetFillColor("cyan");
$plot1->SetShadow();
$plot2->SetFillColor("blue");
$plot2->SetShadow();
$plot3->SetFillColor("darkorange");
$plot3->SetShadow();
//Declare object for the grouped plot
$plot = new GroupBarPlot(array($plot1,$plot2,$plot3));
//Set plot width
$plot->SetWidth(0.6);
//Add plot
$graph->Add($plot);
//Draw the chart
$graph->Stroke();
?>
Output:
The following output will appear after executing the script from the server:
Example 5: Creating a Simple Pie Chart
Create a PHP file with the following script to draw a pie chart. An array has been used to set the data for drawing the chart. The Graph object has been used for displaying the chart, and the PiePlot object has been used to create the simple pie chart by using the Graph object.
//Include necessary files to draw line chart
require_once ('jpgraph-4.3.5/src/jpgraph.php');
require_once ('jpgraph-4.3.5/src/jpgraph_pie.php');
//Set the data
$data = array(10,15,16,23);
//Declare the graph object
$graph = new PieGraph(400, 250);
//Clear all
$graph->ClearTheme();
//Set title for the chart
$graph->title->Set("Simple Pie Chart");
//Create plot objects
$plot = new PiePlot($data);
//Add plot
$graph->Add($plot);
//Draw the chart
$graph->Stroke();
?>
Output:
The following output will appear after executing the script from the server:

Example 6: Creating a 3D Pie Chart
Create a PHP file with the following script to draw a 3D pie chart. Two arrays have been used to set the data for drawing the chart. The PieGraph object has been used for displaying the chart and the PiePlo3D object has been used to create the simple pie chart using the PieGraph object.
//Include necessary files to draw line chart
require_once ('jpgraph-4.3.5/src/jpgraph.php');
require_once ('jpgraph-4.3.5/src/jpgraph_pie.php');
require_once ('jpgraph-4.3.5/src/jpgraph_pie3d.php');
//Set the data
$data = array(15 ,13, 29, 45, 68, 31);
$area = array('Dhaka','Barisal','Sylhet','Comilla','Chandpur','Bogra');
//Declare the graph object
$graph = new PieGraph(550, 300);
//Clear all
$graph->ClearTheme();
//Set some setting for the chart
$graph->title->Set("Area-wise sales");
$graph->legend->SetPos(0.01,0.2,'right','right');
$graph->legend->SetColumns(1);
$graph->legend->SetLineSpacing(15);
//Create plot objects
$plot = new PiePlot3D($data);
$plot->SetCenter(0.4);
$plot->SetLegends($area);
//Add plot
$graph->Add($plot);
//Draw the chart
$graph->Stroke();
?>
Output:
The following output will appear after executing the script from the server:

Conclusion:
In this article, all data used in the previous examples are static. You can easily fetch data from the database server using PHP and use them for creating a chart based on dynamic data. If you want to create a more attractive chart and faster download, then you can use any popular client-side library. We hope you found this article helpful. Check the other Linux Hint articles for more tips and information.