The polyfit() function in MATLAB is an effective tool for using a set of data points to fit a polynomial curve. It calculates the coefficients of the polynomial that best fits the given data using the method of least squares. This functionality is particularly useful when you want to estimate or approximate a relationship between variables based on observed data.
In this article, we will explore the output of the polyfit() function in MATLAB and understand how it can provide valuable information for polynomial curve fitting tasks.
What is the Output of polyfit() in MATLAB?
The output of the polyfit() function in MATLAB is a set of numbers called coefficients that represent the mathematical equation of a polynomial curve fitted to a given set of data points.
The polynomial degree you need to fit must be specified before using the polyfit() function. For example, a straight line corresponds to a polynomial of degree 1, while a parabola corresponds to a polynomial of degree 2. The degree determines the complexity of the polynomial curves.
The polyfit() function calculates the coefficients through the least squares method (a widely used method for finding the best possible fit for the given data points).
Keep in mind that using higher-order polynomials does not always guarantee a better fit, while the lower-degree polynomials can provide you with a more accurate and better representation of the underlying relationship in the data.
Syntax for polyfit() Function
The syntax for polyfit() function in MATLAB is given below:
[p,S] = polyfit(x,y,n)
[p,S,mu] = polyfit(x,y,n)
The description of the above syntax is given as:
-
- p = polyfit(x,y,n): yields the coefficients for the polynomial p(x) of degree n that provides the best fit (in the sense of least-squares) for the data in y. The length of p is n+1, and In p, the coefficients are ordered by decreasing powers.
- [p,S] = polyfit(x,y,n): yields a structure S, which may be used in polyval as an input to get error estimates.
- [p,S,mu] = polyfit(x,y,n): yields mu that is a two-element vector with values for scaling and centering. The mu(1) is mean(x), whereas mu(2) is std(x). Using these settings, polyfit() scales x to have a unit standard deviation, where it centers x at zero.
How to Use polyfit() Function in MATLAB?
This section illustrates some basic examples of using the MATLAB polyfit() function.
Example 1
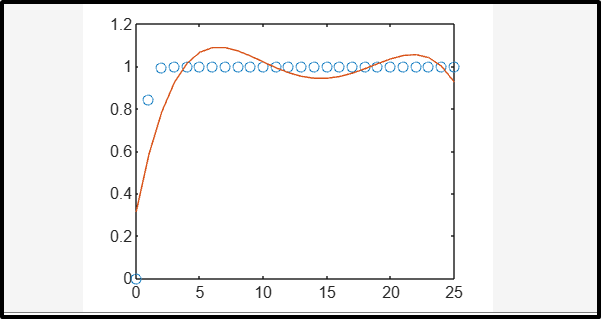
In the given example, we first generate a vector x with 25 equally spaced elements lying in the interval (0, 25). Then we find y values corresponding to all x values using the error function erf(x). After that, the polyfit() function is used to fit the 4th-degree polynomial curve to the data points. At last, we plot the results of the polynomial evaluation with a finer grid. Here the fit might not be good because erf() is a bounded function while polynomial is the unbounded function.
y = erf(x);
p = polyfit(x,y,4);
f = polyval(p,x);
plot(x,y,'o',x,f,'-')
Output
Example 2
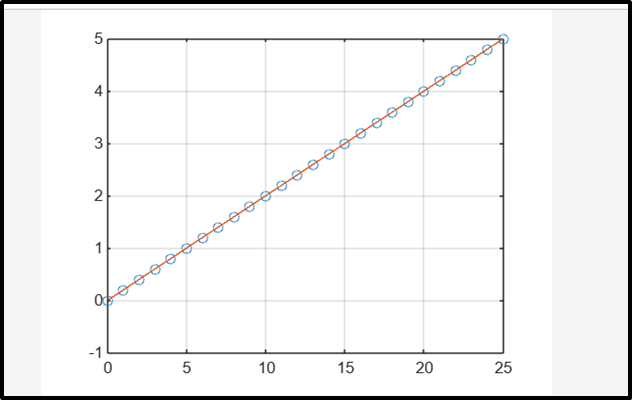
In the following example, we create two vectors, x, and y, representing the independent and dependent variables, respectively. The x vector is generated with values ranging from 0 to 25, while the y vector is generated with values ranging from 0 to 5, incrementing by 0.2 at each step.
Next, we utilize the polyfit() function, passing in the vectors x, y, and a degree of 5, to estimate the coefficients of a 5th-degree polynomial that best fits the given data points. The vector p contains the coefficients that are obtained.
In order to visualize the fitted polynomial curve, we employ the polyval() function, supplying it with the coefficients p and the vector x. This allows us to compute the corresponding y values for each x value, producing the vector f. Finally, we plot the original data points as markers (‘o’) and the fitted polynomial curve using the plot() function. Additionally, we enable grid lines for a clearer visualization of the plot.
y = [0:0.2:5];
p = polyfit(x,y,5);
f = polyval(p,x);
plot(x,y,'o', x,f)
grid on
Output
Conclusion
The polyfit() function is a powerful tool in MATLAB for polynomial curve fitting. By providing two vectors representing the independent and dependent variables, along with the desired degree of the polynomial, this function efficiently calculates the coefficients that best fit the data points. The polynomial can then be evaluated and further values can be predicted using the obtained coefficients.