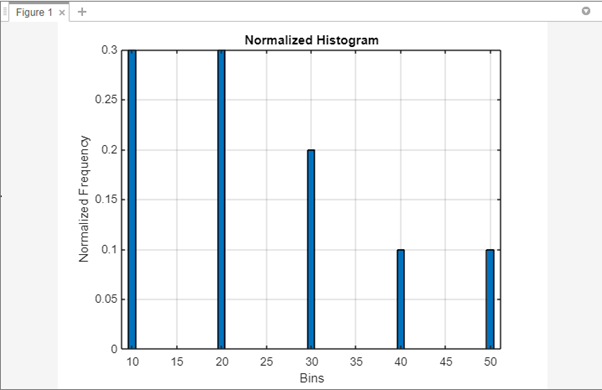
Normalizing a histogram is a crucial process in data analysis and visualization. MATLAB, a powerful computational tool, provides various functions to help you normalize histograms effectively. In this article, we will explore the step-by-step process of normalizing a histogram in MATLAB, allowing you to gain insights into your data and make meaningful comparisons.
How to Normalize a Histogram in MATLAB?
A normalized histogram is a plot of the frequencies of data values, where the frequencies have been normalized so that they sum to 1. This means that the normalized histogram can be used to compare the distributions of different datasets, even if the datasets have different sizes, here are some steps to plot a normalized histogram:
Step 1: Load Data and Create Histogram
To begin, you need to load your data into MATLAB and create a histogram using the histogram() function. This function calculates the bin counts and bin locations based on your data. Here’s an example code:
histogram(data);
Step 2: Retrieve the Histogram Data
After creating the histogram, you can obtain the bin counts and bin edges using the histcounts() function. This function returns the counts in each bin and the corresponding edges. Store these values in separate variables for further processing:
Step 3: Compute the Normalized Values
In order to normalize the histogram, it is necessary to divide the count of each bin by the total number of data points. This ensures that the histogram represents the relative frequency distribution rather than the absolute count. Here’s how you can compute the normalized values:
normalizedValues = counts / totalDataPoints;
Step 4: Adjust the Bin Edges
In some cases, it might be necessary to adjust the bin edges to align the normalized histogram properly. To do this, you can calculate the midpoints between adjacent bin edges and use them as the new bin centers. Here’s an example code :
Step 5: Plot the Normalized Histogram
Now that you have the normalized values and adjusted bin centers, you can plot the normalized histogram using the bar() function. Set the bin centers as the x-axis values and the normalized values as the corresponding y-axis values:
Here is the complete MATLAB code that normalize a histogram:
data = [10, 20, 30, 40, 50, 10, 20, 30, 10, 20];
histogram(data);
% Step 2: Get the Histogram Data
[counts, edges] = histcounts(data);
% Step 3: Get the Normalized Values
totalDataPoints = sum(counts);
normalizedValues = counts / totalDataPoints;
% Step 4: Modify the Bins
binCenters = (edges(1:end-1) + edges(2:end)) / 2;
% Step 5: Plot the Normalized Histogram
bar(binCenters, normalizedValues);
% Step 6: Customize the Plot
xlabel('Bins');
ylabel('Normalized Frequency');
title('Normalized Histogram');
grid on;
I have added an example dataset data and used it to create a histogram. This code will create a histogram, compute the normalized values, adjust the bin edges, and plot the normalized histogram.
Note: The code assumes you have the MATLAB Image Processing Toolbox installed, which includes the histogram and histcounts functions.
Conclusion
Normalizing a histogram in MATLAB is a straightforward process that allows you to gain insights into the relative frequency distribution of your data. Divide the count of each bin by the total number of data points to normalize the histogram.

