Finding a normal distribution of a data set is not an easy task; however, we can perform it in MATLAB using the fitdist() function. Read this guide to learn in detail about working with the normal distribution in MATLAB using the fitdist() function.
What is Normal Distribution
A normal distribution also termed a Gaussian distribution is defined using two parameters; mean and standard deviation of the data points. The mean measures the average of data values, while the standard deviation measures how data values are spread out around the mean. With the combination of both Mean and Standard deviation, we can calculate normal distribution from the following formula:

Where:
- x represents dataset values.
- f(x) represents the probability function.
- μ denotes the
- σ denotes the standard deviation.
How to Perform Normal Distribution in MATLAB Using the fitdist() Function
MATLAB lets us calculate the normal distribution of random variables using the built-in fitdist() function. This function produces a normal probability distribution object by fitting the given distribution to the input data. The normal distribution accepts two parameters as input: the standard deviation as well as the mean. A standard normal distribution has zero mean value as well as a unit standard deviation that is 1. This means that the normal distribution is centered at zero and the values of the distributions are spread out equally on both sides of the mean.
Syntax
The fitdist() in MATLAB can be used in different ways:
pd = fitdist(x,distname,Name,Value)
pdca,gn,gl] = fitdist(x,distname,'By',groupvar)
Here:
- The function pd = fitdist(x,distname) is responsible for fitting the distribution provided by distname to the data contained in column vector x to produce a probability distribution object.
- The function pd = fitdist(x,distname,Name,Value) is responsible for building the probability distribution object with one or more name-value pair arguments that specify extra parameters.
- The function [pdca,gn,gl] = fitdist(x,distname,’By’,groupvar) is responsible for fitting the probability distribution defined by distname to the data in column vector x based on the grouping variable groupvar to generate probability distribution objects. It gives back a cell array of fitted probability distribution objects, denoted as pdca, a cell array of group labels, denoted as gn, and a cell array of grouping variable levels, denoted as gl.
Example 1: How to Find Normal Distribution Using fitdist(x,distname) Function
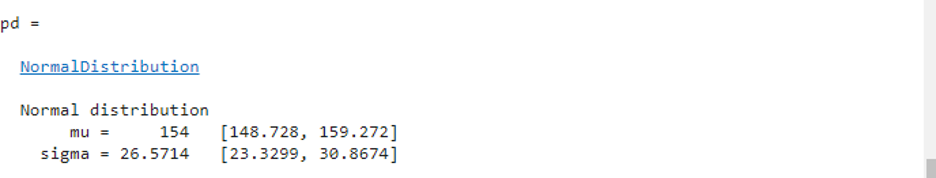
This example fits a normal distribution to the sample data z using the fitdist() function.
z = Weight;
pd = fitdist(z,'Normal')
Example 2: How to Find Normal Distribution Using fitdist(x,distname,Name,Value) Function
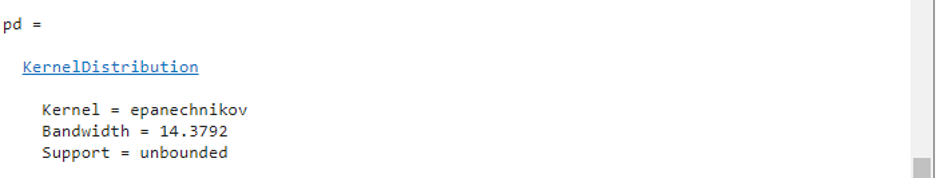
In this example, we are going to fit a Kernel distribution to the sample data using the fitdist() function in MATLAB.
z = Weight;
pd = fitdist(z,'Kernel','Kernel','epanechnikov')
Example 3: How to Find Normal distribution Using fitdist(x,distname,’By’,groupvar) Function
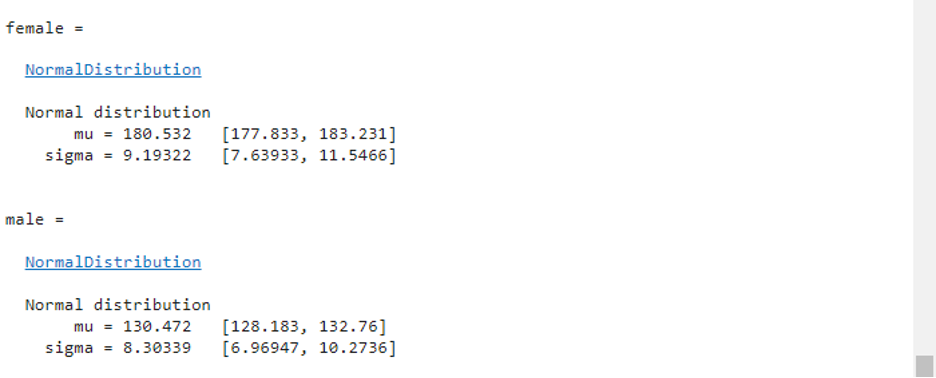
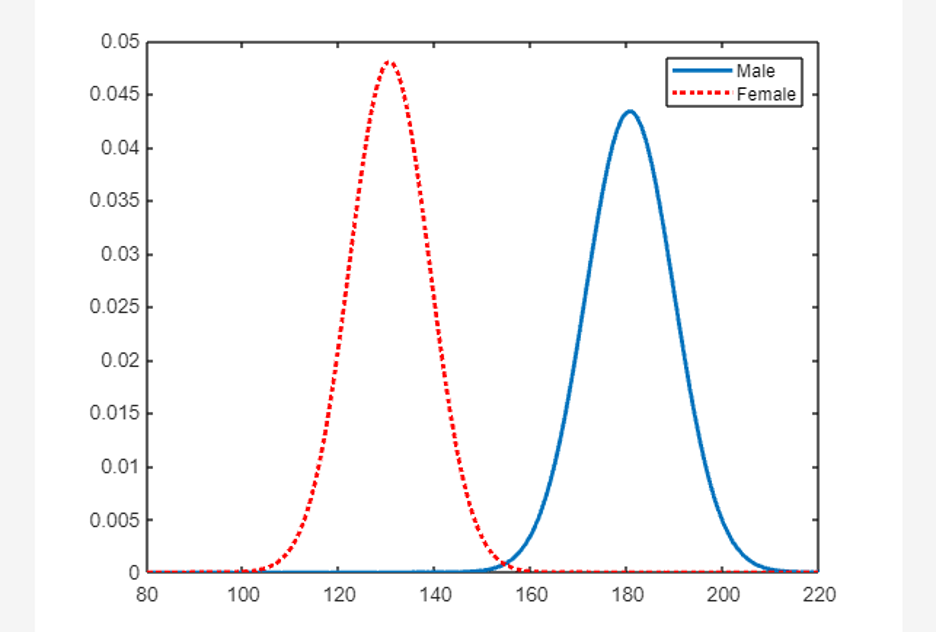
The given below MATLAB code fits normal distributions to grouped data, computes and plots the pdf of both groups of data.
z = Weight;
[pdca,gn,gl] = fitdist(z,'Normal','By',Gender)
female = pdca{1}
male = pdca{2}
z_values = 80:1:220;
femalepdf = pdf(female,z_values);
malepdf = pdf(male,z_values);
figure
plot(z_values,femalepdf,'LineWidth',2)
hold on
plot(z_values,malepdf,'Color','r','LineStyle',':','LineWidth',2)
legend(gn,'Location','NorthEast')
hold off
Conclusion
Finding the normal distribution of a dataset is a statistical technique that is widely used in machine learning, artificial intelligence, data science, and many other fields. It can be defined using two parameters; mean as well as standard deviation of the data points. We can fit the dataset in the normal distribution object using the fitdist() function. This guide has provided the basics of the normal distribution function and how to work with it in MATLAB using the fitdist() function.