The mesh plot is a three-dimensional graph used for representing functions of the form z= f(x,y), where x and y are independent variables and z is the dependent variable. It implies that every combination of x and y within a certain domain can be used to calculate the value of z.
How to Create Mesh Plot in MATLAB?
You can create mesh plots in MATLAB using the built-in mesh() function. Follow the below-given steps to create mesh plots in MATLAB using this function.
Step 1: First, we need to create a grid in the xy-plane using the meshgrid() function that covers the domain of the specified function.
Step 2: We have to calculate the value of the given function for each point in the grid.
Step 3: Plot the z = f(x, y) using the mesh() function.
The mesh() function follows a simple syntax in MATLAB that is given below:
mesh(Z)
mesh(Z,C)
mesh(___,C)
mesh(ax,___)
mesh(___,Name,Value)
s = mesh(___)
Here:
mesh(X, Y, Z) maps X, Y, and Z on a three-dimensional surface where matrix Z is shown as a height above the x-y plane and matrices X and Y are shown along the x-y plane. If Z has the size m-by-n then X should have the same size as Z or a vector of size n and Y should be the same size as Z or a vector of size m.
mesh(Z) generates a mesh surface plot using matrix Z by using column and row indices as the respective x and y coordinates.
mesh(Z, C) yields to determine the edges’ color.
mesh(___, C) generates a mesh surface plot with the desired edge color as C, where C is an m-by-n-by-3 RGB array.
mesh(ax,___) specifies the mesh plot’s axes in place of the current axes.
mesh(___, Name, Value) uses the supplied Name-Value pair inputs to build a mesh surface plot.
s = mesh(___) produces a mesh plot using the provided variables and then returns the mesh plot’s chart surface objects which can still change the mesh plot after constructing it.
Examples
Consider some examples that demonstrate the above syntax.
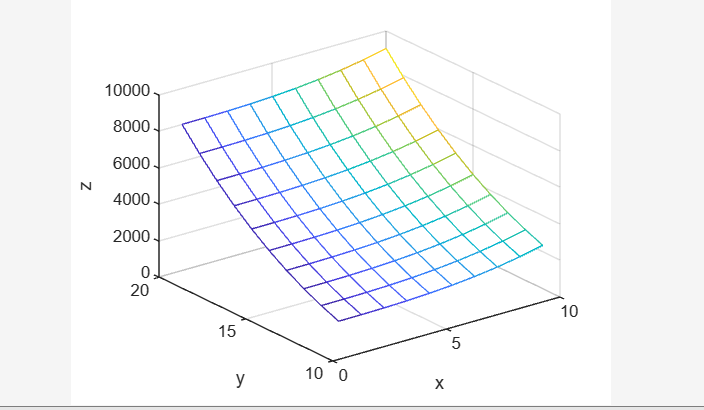
Example 1
In the given example, first, we create a meshgrid using the given vectors x and y and then we initialize Z as a function of X and Y. After that we plot X, Y, and, Z using the mesh(X, Y, Z) function.
Y = [11:20];
[X,Y] = meshgrid(X,Y);
Z = X.^3 + Y.^3;
mesh(X, Y, Z);
xlabel('x');
ylabel('y');
zlabel('z');

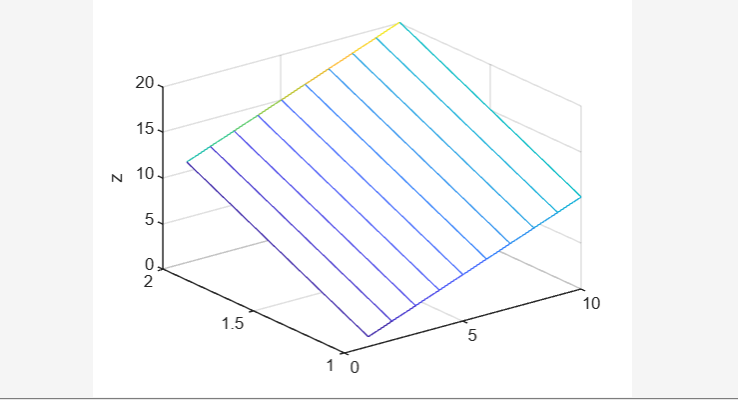
Example 2
This MATLAB code first, creates a meshgrid using the given vector Z. After that it plots Z using the mesh(Z) function.
mesh(Z);
zlabel('z');
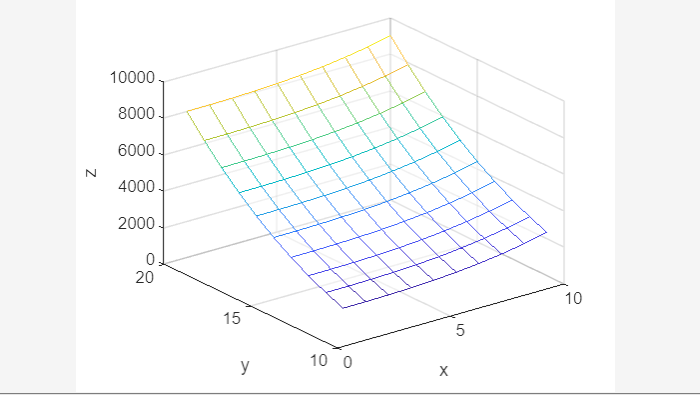
Example 3
This example first creates a meshgrid using the given vectors x and y and then it initializes Z and C where Z is a function of X and Y and C is a color map. After that, we plot X, Y, and, Z along the color map C using the mesh(X, Y, Z, C) function.
Y = [11:20];
[X,Y] = meshgrid(X,Y);
Z = X.^3 + Y.^3;
C = X.*Y;
mesh(X, Y, Z, C);
xlabel('x');
ylabel('y');
zlabel('z');
Example 4
In this example, first, we create a meshgrid using the given vectors x and y and then we initialize Z as a function of X and Y. After that we plot X, Y, and, Z using the mesh(X, Y, Z, Name, Value) function by specifying the characteristics like FaceAlpha and EdgeColor.
Y = [11:20];
[X,Y] = meshgrid(X,Y);
Z = X.^3 + Y.^3;
mesh(X,Y,Z,'FaceAlpha','0.5','EdgeColor','flat');
xlabel('x');
ylabel('y');
zlabel('z');
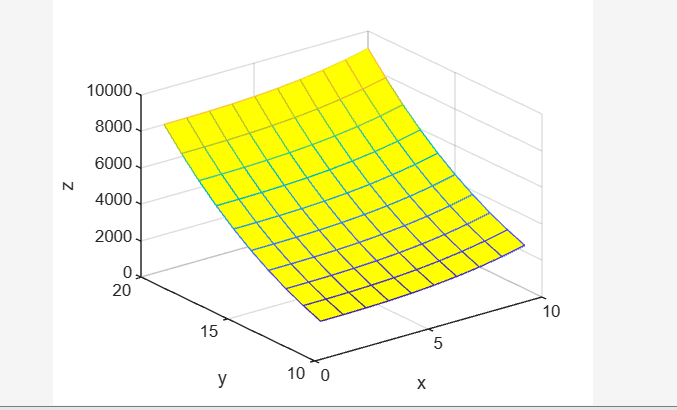
Example 5
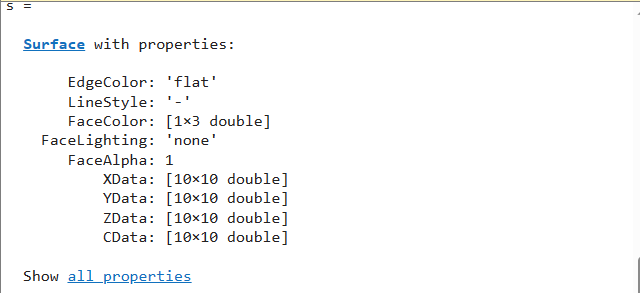
In this MATLAB code, first, we create a meshgrid using the given vectors x and y and then we initialize Z as a function of X and Y. After that we plot X, Y, and, Z using the s= mesh(X, Y, Z) function which returns an object s that can change the properties of the plot using (.) operation.
Y = [11:20];
[X,Y] = meshgrid(X,Y);
Z = X.^3 + Y.^3;
s = mesh(X,Y,Z);
s.LineStyle = '-';
s.FaceColor = '[1 1 0]';
xlabel('x');
ylabel('y');
zlabel('z');
Conclusion
A mesh plot is a 3-D plot used for plotting the function of the type z = f(x, y). This plot can be created in the MATLAB using mesh() function which accepts x, y, and, z as arguments and returns a 3-D plot that is a visualization of the plotted function. This guide explored what is mesh plot and how it works in MATLAB using multiple examples.