What is a subplot?
The subplot is a useful function in MATLAB that allows users to display multiple plots in a single figure. It helps visualize and compare different data sets in a well-organized manner. Dividing the figure into a grid of smaller subplots will enable you to plot multiple graphs, images, or charts into a single figure window, making it easier for you to analyze and interpret the data.
Syntax for subplot Function in MATLAB
The general syntax for using the subplot function in MATLAB is given below:
Where m, n are the number of rows and columns of the plot grid, while p is the index of the plot and it starts from 1 in the upper left corner of the figure and increases from left to right, then top to bottom.
How to Use subplot in MATLAB?
Using a subplot in MATLAB is pretty straightforward, as you have to define the rows and columns of the plot and set the index. For example, to plot two figures on a single window, you can use the following code:
figure
subplot(2, 2, 1)
plot(x1, y1)
title('Plot 1')
xlabel('X-axis')
ylabel('Y-axis')
subplot(2, 2, 2)
bar(x2, y2)
title('Plot 2')
xlabel('X-axis')
ylabel('Y-axis')
The above code will plot two figures on a single window. Let’s provide a simple example to illustrate the above process.
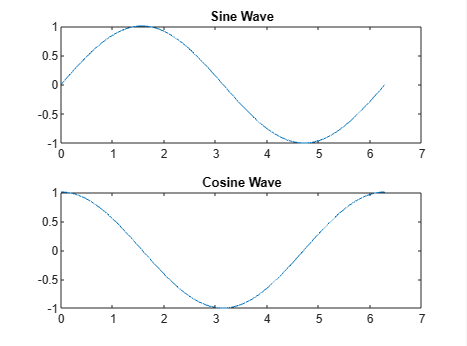
x = 0:0.01:2*pi;
y1 = sin(x);
y2 = cos(x);
% Create a figure with two subplots
figure
subplot(2,1,1) % First subplot with 2 rows, 1 column, and position 1
plot(x,y1)
title('Sine Wave')
subplot(2,1,2) % Second subplot with 2 rows, 1 column, and position 2
plot(x,y2)
title('Cosine Wave')
The above code will plot two plots on two rows with a single column.
To plot the figures side by side on a single window, you can use the following code:
x = 0:0.01:2*pi;
y1 = sin(x);
y2 = cos(x);
% Create a figure with two subplots
figure
subplot(2,2,1) % First subplot with 2 rows, 2 column, and position 1
plot(x,y1)
title('Sine Wave')
subplot(2,2,2) % Second subplot with 2 rows, 2 column, and position 2
plot(x,y2)
title('Cosine Wave')
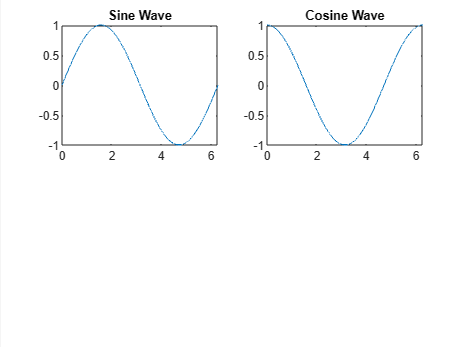
In this way, you can use the subplot function to easily plot multiple figures on a single window in MATLAB.
Conclusion
The subplot is a useful function in MATLAB that allows you to plot multiple figures on a single window. Its syntax is pretty simple where you have to define several rows, and columns, and plot the index to plot the figures on a single window. Whether you are a beginner or an experienced user, using subplots in MATLAB can greatly enhance your data visualization capabilities and make your projects more meaningful and easier to understand.