This blog will demonstrate:
- What is Logstash?
- Prerequisites: How to Install and Setup Elasticsearch?
- How to Download and Configure Logstash With Elasticsearch?
What is Logstash?
Logstash is a logs analytical tool that works with Elasticsearch to analyze and manage logs. It usually gets the data and classifies it into classes or clusters. After that, it processes the data and sends it directly to Elasticsearch indexes using the pipeline. It can get the data and transform it using filters and also can display the data through output plugins.
Prerequisites: How to Install and Setup Elasticsearch on Windows?
To install Logstash and configure it to Elasticsearch, users are required to install and start Elasticsearch first on the system. To install and set up the latest version of Elasticsearch on Windows, utilize the “.zip” setup from its official website.
To get a detailed guide on how to install and set up Elasticsearch, visit our associated article.
How to Download and Configure Logstash With Elasticsearch?
To install the Logstash and configure it with Elasticsearch, first download its “zip” setup from Elasticsearch’s official website. After that, configure the Elasticsearch indexes with Logstash by creating the “logstash.config” file.
For demonstration, follow the instructions given below.
Step 1: Download Logstash “.zip” Setup
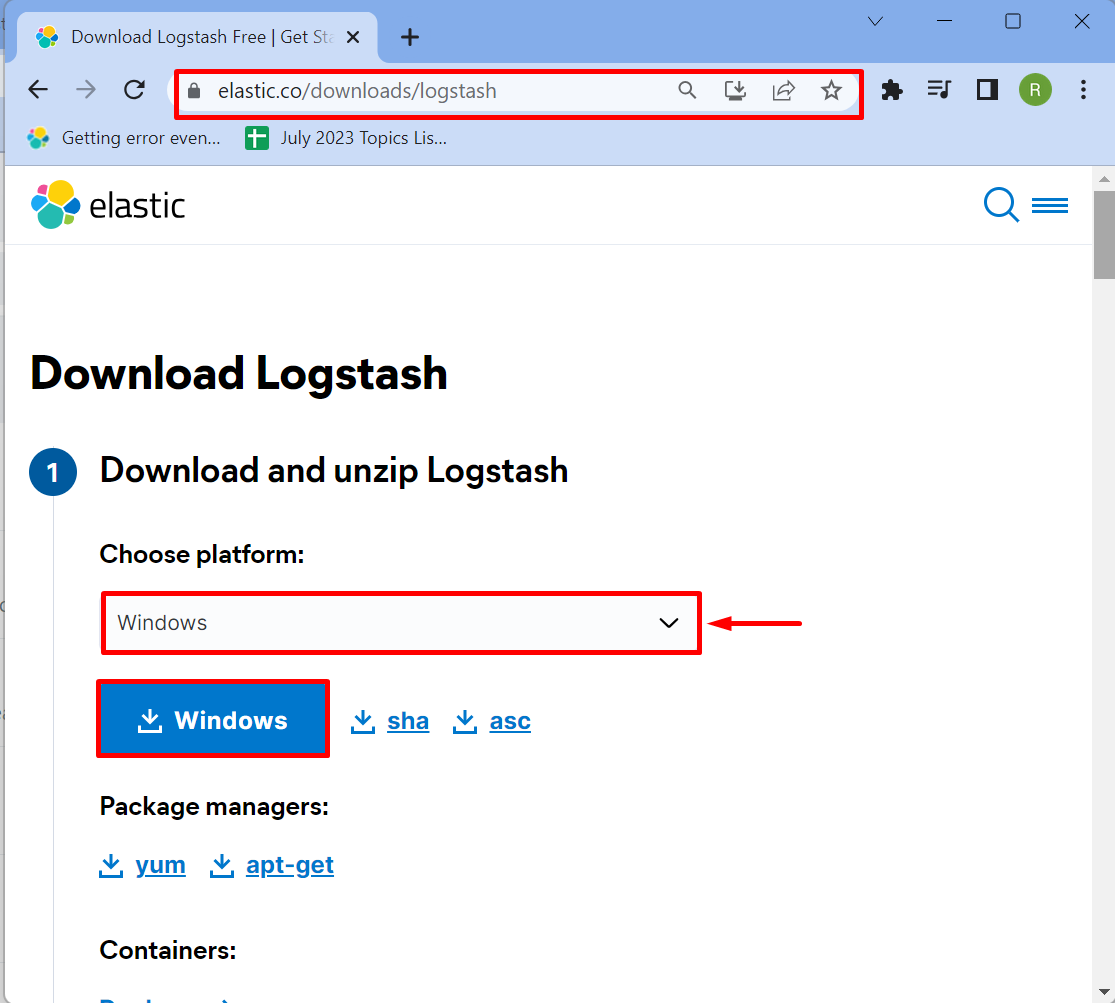
First, navigate to Elasticsearch’s official website and download the Logstash zip setup for Windows by hitting the “Windows” button. Users can download Logstash setup for other platforms using the below-highlighted drop menu:
Step 2: Extract the Setup
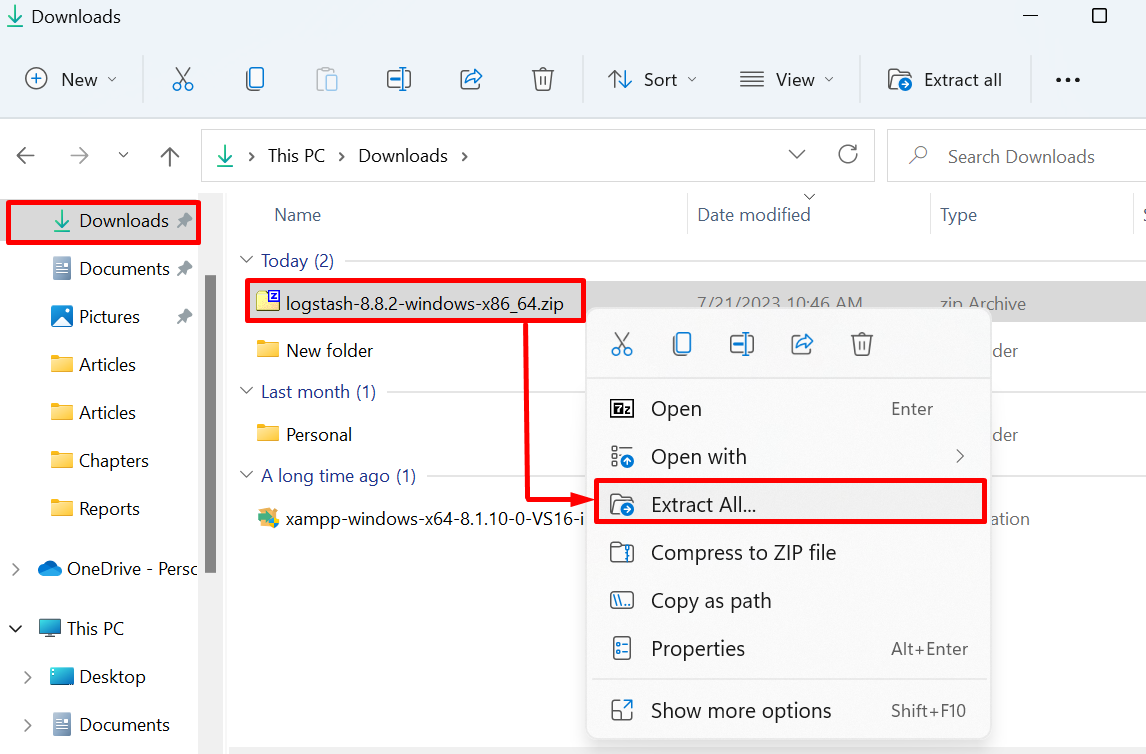
Navigate to the “Downloads” directory and extract the Logstash setup. For this purpose, right-click on the Logstash “.zip” file, and choose the “Extract All” option:
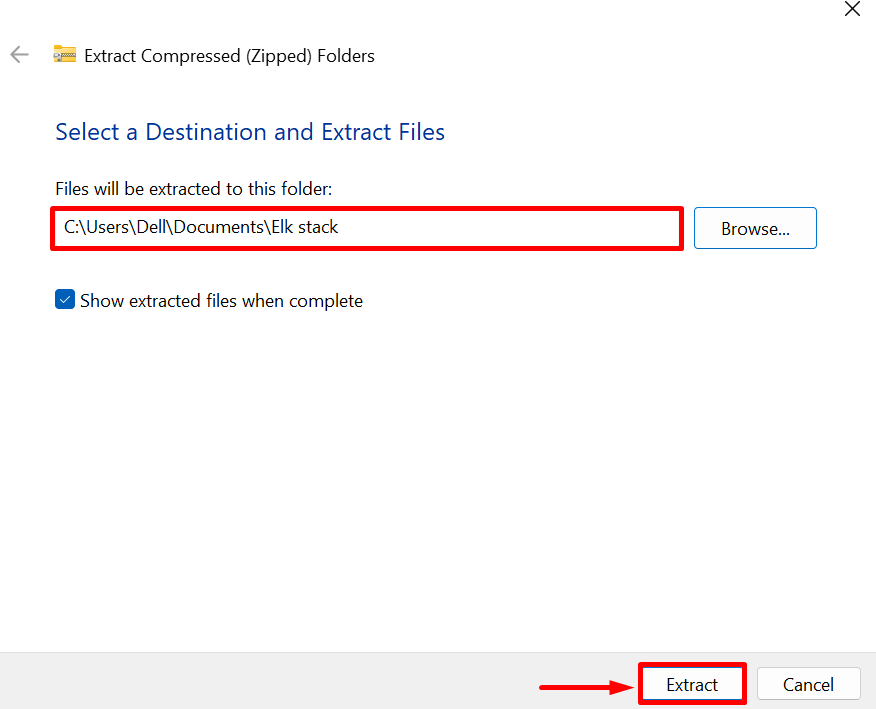
Browse the path where you want to extract the setup and hit the “Extract” button. It is recommended to extract the Logstash setup in that directory where Elasticsearch and Kibana are installed or extracted:
Step 3: Create “logstash.conf” File
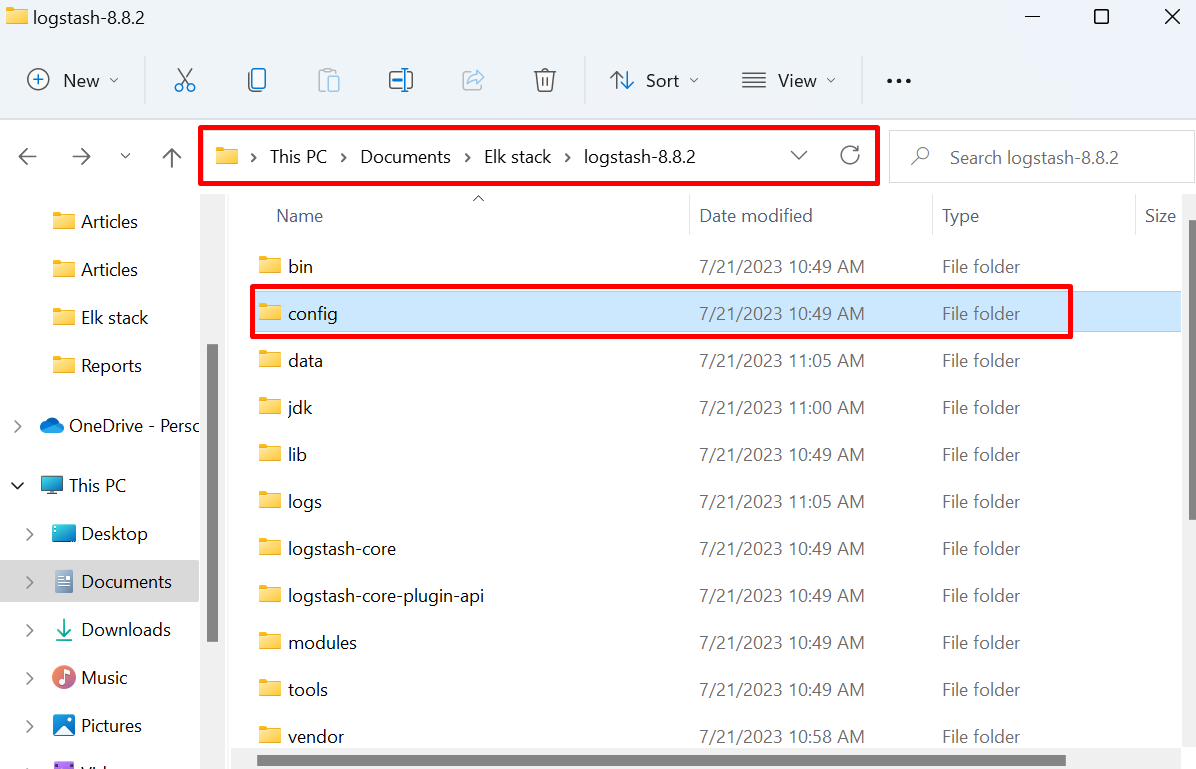
Next, open the Logstash extracted folder and navigate to its “config” directory:
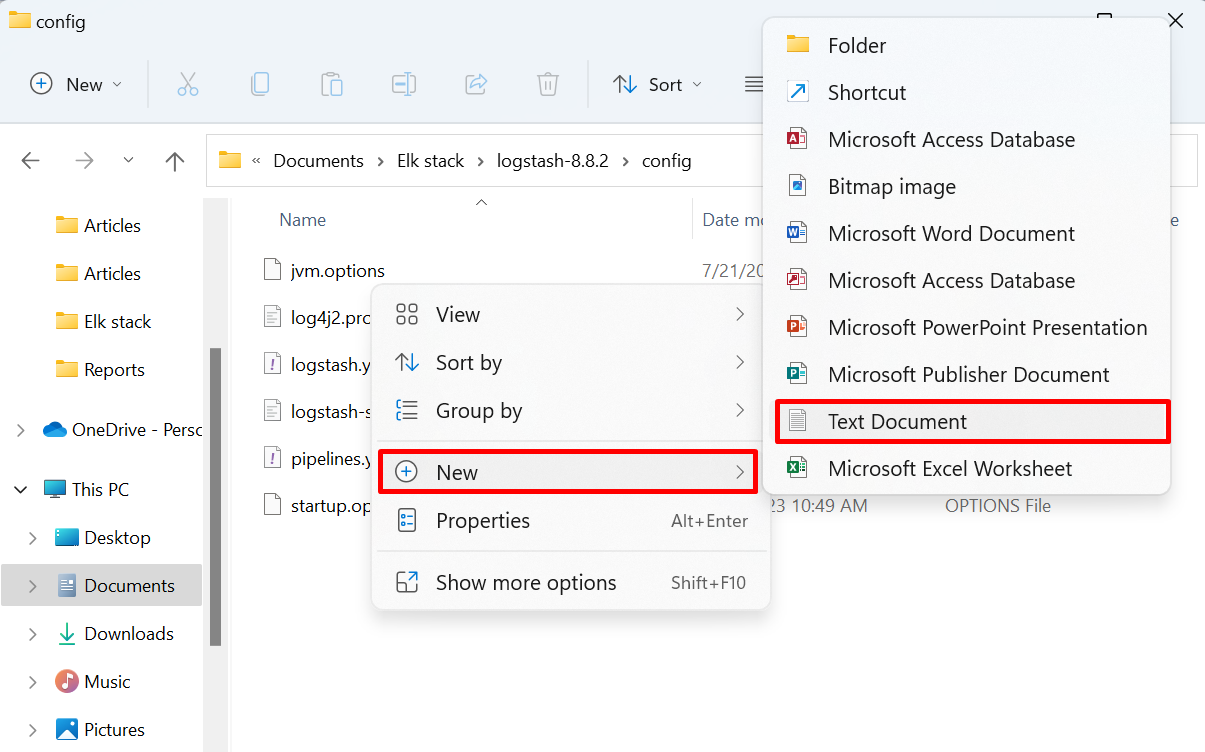
Create a new file to configure Logstash with Elasticsearch. For this purpose, right-click on the screen and move the mouse cursor over the “New” option. After that, choose the “Text Document” option from the appeared sub-context menu:
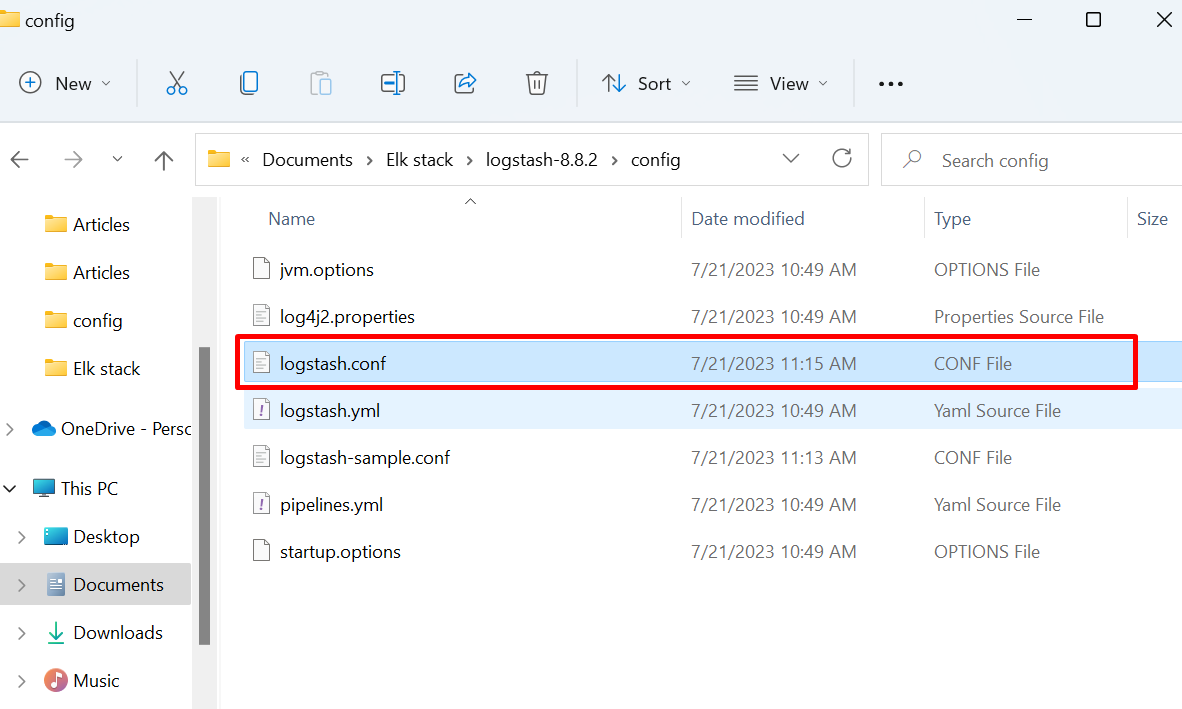
Name the file as a “logstash.conf” file and also remove the “.txt” extension:
Now, paste the following instructions into the file. In the below instruction, change the “index” value to which you want to connect Logstash, and provide your username and password to access Elasticsearch:
stdin {
}
}
output {
stdout {
codec => rubydebug
}
elasticsearch {
hosts => ["http://localhost:9200"]
index => "test.logstash"
user => "elastic"
password => "jSo-sQ*XseQ8nygL=tL="
}
}
Step 4: Start Elasticsearch
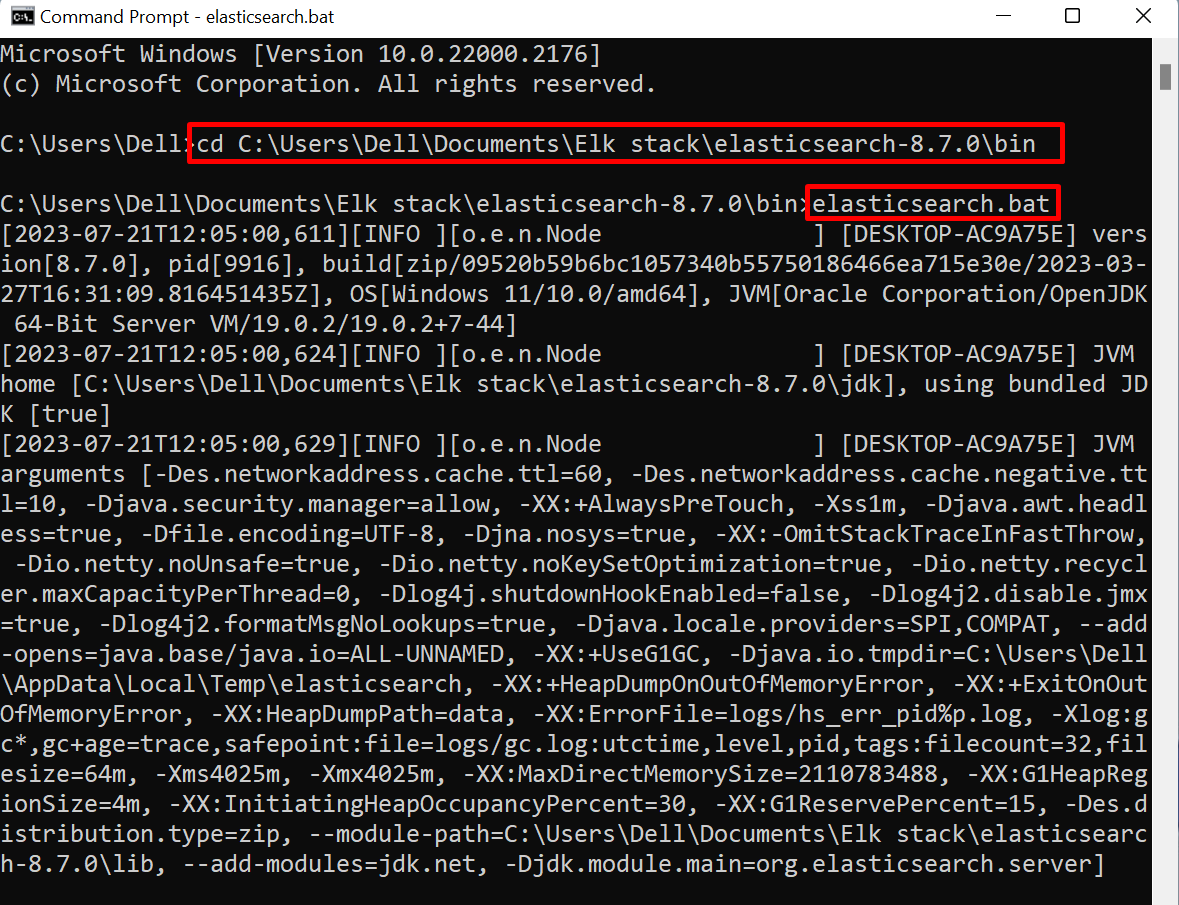
In the next step, run the Elasticsearch. For doing so, navigate to Elasticsearch “bin” directory with the help of the “cd” command:
Run the Elasticsearch batch file through the given command to start the Elasticsearch engine:
Step 5: Open Logstash “bin” Directory in Command Prompt
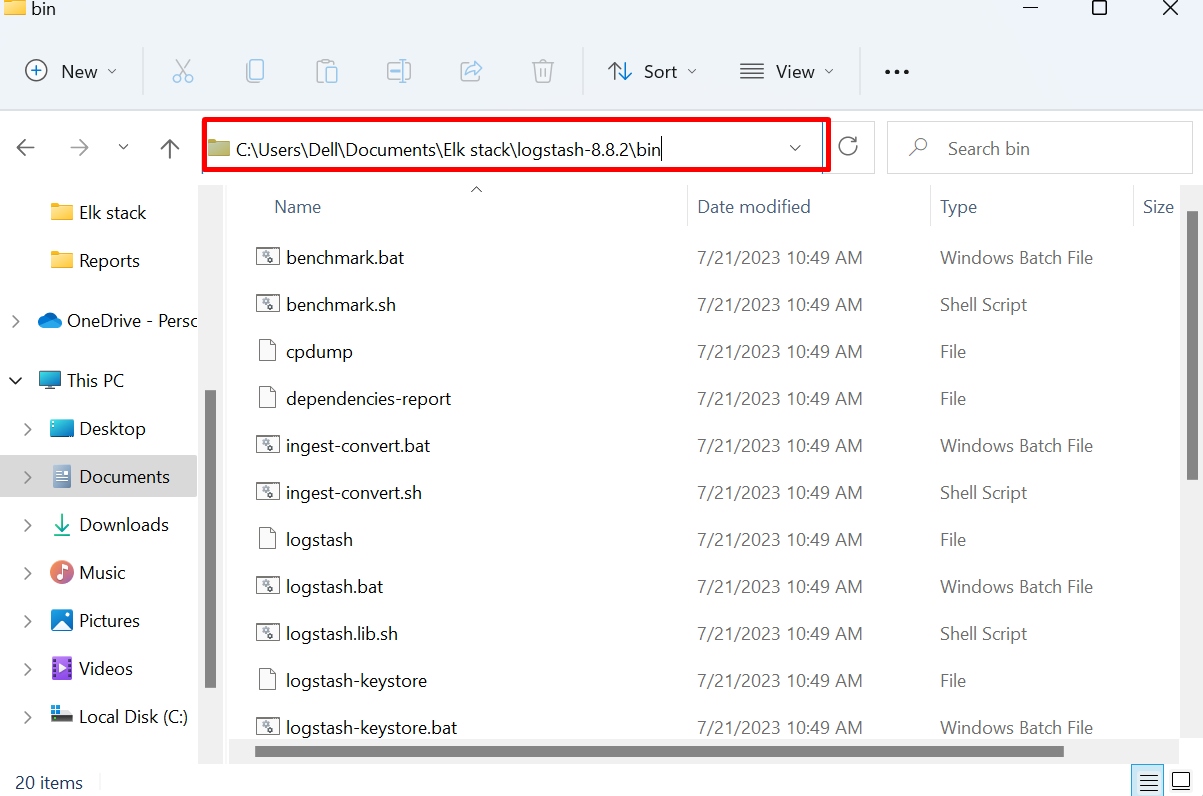
After that, open the “bin” directory of the Logstash setup as shown below:
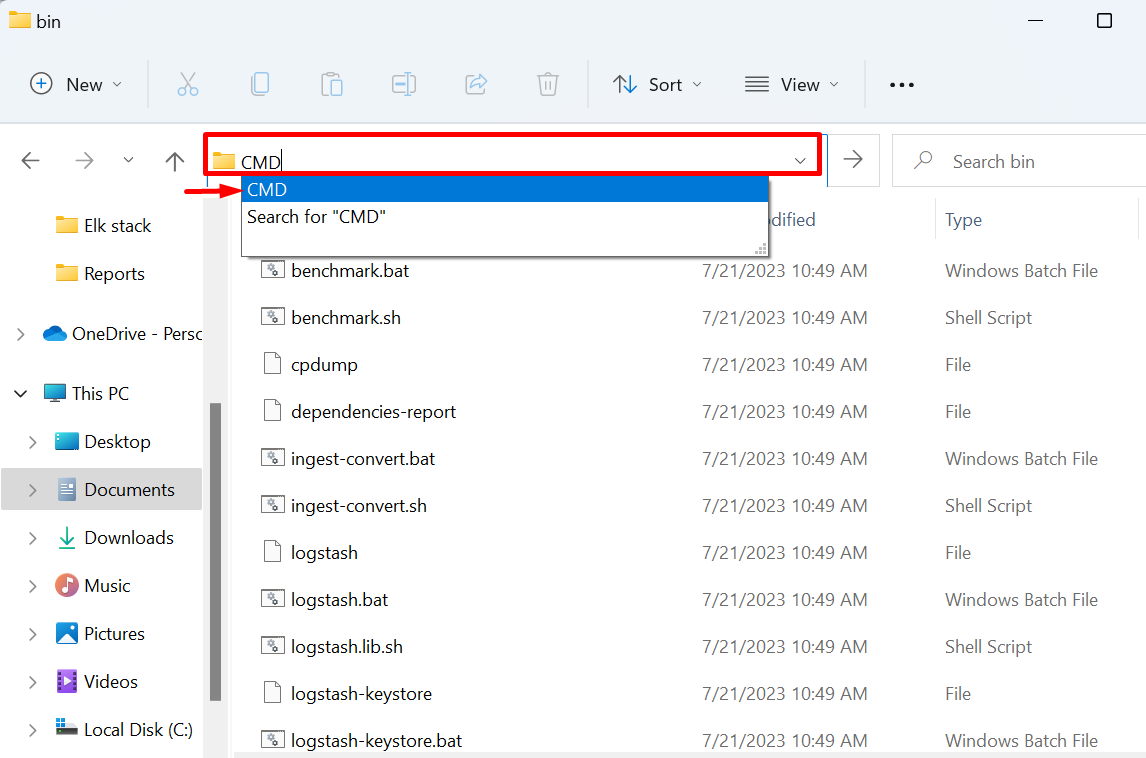
Make a search for “CMD” in the address bar and open the Logstash “bin” directory in Command Prompt:
Step 6: Configure and Start Logstash With Elasticsearch
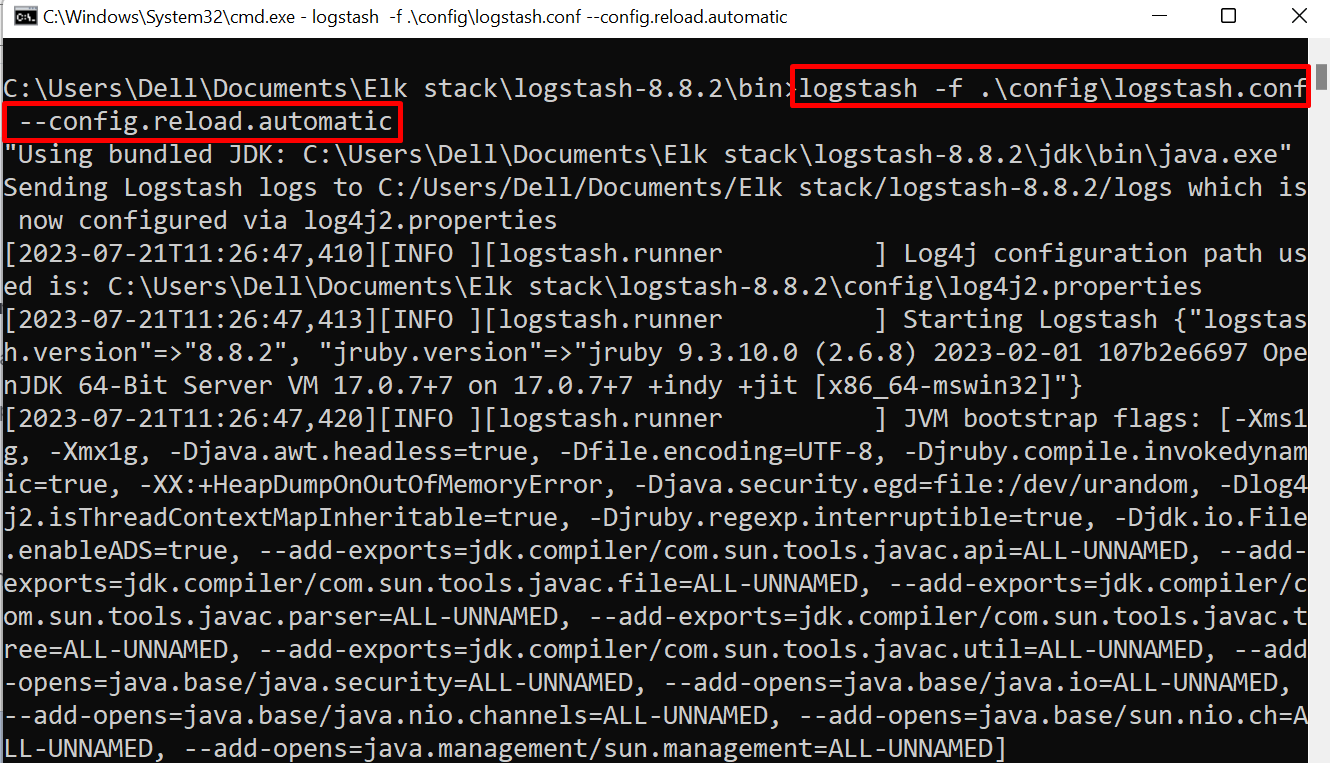
Now, execute the following command to configure and start Logstash with Elasticsearch. Here, the “-f” option is utilized to read the “logstash.conf” file from the provided path:
Step 7: Verification
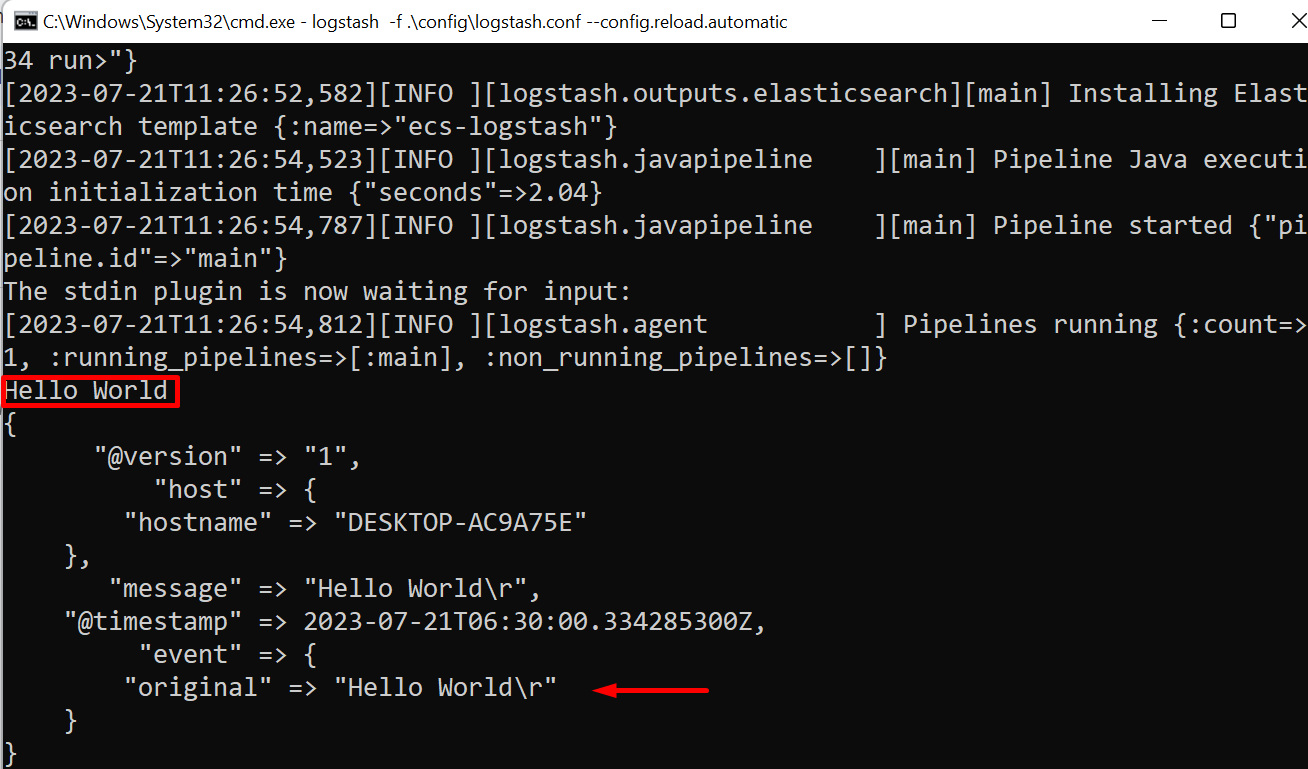
When the pipelines of the selected index are started, now the user can directly add and view the data from the index. For verification, send some data or messages such as we have sent “Hello World”:
That is all about configuring Logstash with Elasticsearch.
Conclusion
Logstash is a logs analytical tool that works with Elasticsearch to analyze and manage logs. To configure Logstash with Elasticsearch, run the Elasticsearch engine on the system. After that, download the setup for Logstash. Create a new file named “logstash.conf” file in which add the instructions to configure Logstash with Elasticsearch. Next, utilize the “logstash -f <path to “logstash.conf” file>” to configure and start the Logstash. This post has illustrated the method to configure Logstash with Elasticsearch.

