How To Choose Linux Monitoring Tools:
Open-Source or Closed
The first point you need to keep in mind is whether you want an open-source setup or a closed-source one. The main drawback of closed-source software is that it is paid. But if you’re dealing with a huge network, though, and you don’t have the time to troubleshoot with the help of online forums, then that might be the way to go. With closed-source, anytime you can ask for and get instant customer support. That alone can be well worth the initial fee if you have a question or concern.
With closed-source software, you also get streamlined usability and usually higher levels of protection as well. Open-source software, by contrast, is challenging to hack, but not impossible.
Scalability
When you’re going to choose your network monitoring tool, you should take into account the scalability and size of your network. Because a lot of open-source software is designed particularly for smaller-sized systems.
If you are running an extensive corporate network with many nodes, then you shouldn’t even be considering something like the next tools: SolarWinds NetFlow Traffic Analyzer or Paessler PRTG Network Monitor. These services would be appropriate for those large-scale networks that might need to expand their user numbers with virtually no warning.
Another option to consider might be such a service like Ganglia. This one is highly scalable but has such cons as lack of automatic data analysis. Such tools like SolarWinds NTA or Nagios Network Analyzer are more comprehensive and suitable for their security alert setups and real-time analysis.
Support
What others need to consider when looking for Linux monitoring tools. It is vital that you think about the level of support that you need. When you look into open-source programs, you should be ready that there is no support service, except the users’ community. Hence, you should be aware of their online user community and how it’s active. But if you prefer getting instant support or your business needs require that, then the open-source software with a ready-to-help customer support team would be a better choice for you. Moreover, some tools like EventSentry Light offer a quick alert system and troubleshooting of any issue.
Overview of The Best Open-Source Linux Network Monitoring Tools
Some drawbacks of open-source monitoring are that these tools tend to be more time-consuming to use, and they can also be less user-friendly. You also sometimes run into malicious edits with them, which is almost unheard of with a closed-source program. But the most open-source tools have a lot of features as closed-source services and even more and are free. That is especially true when there’s a robust online user community that you can appeal to for advice if you need it.
Nagios
With Nagios, you’re capable of monitoring nearly any type of component. Those would include websites, middleware, system metrics, network protocols, operating systems, applications, web servers, and more.
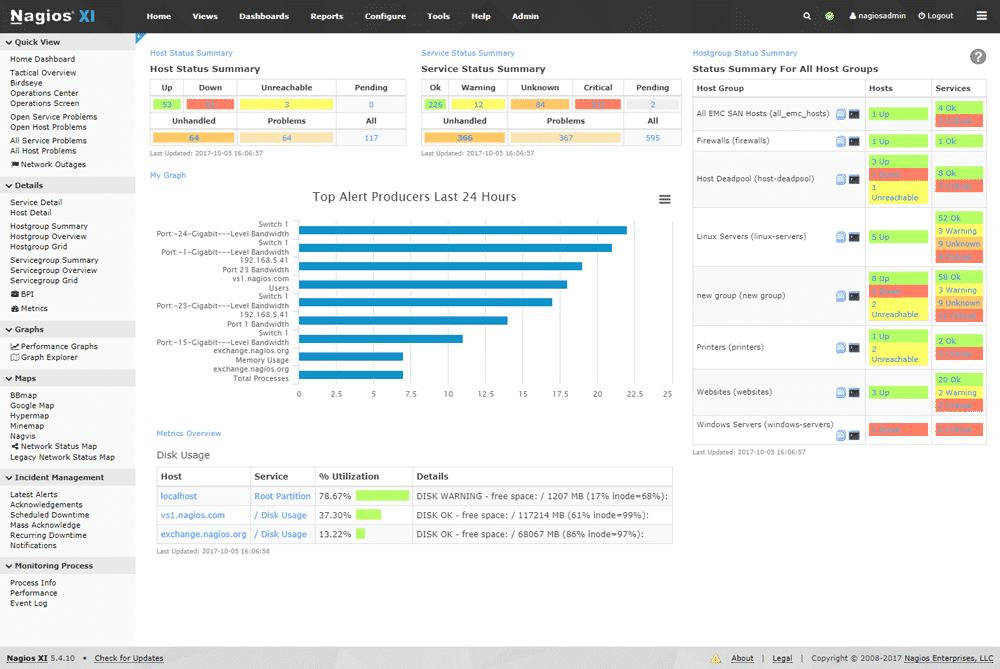
Nagios is based on what is called a Core 4 engine for monitoring. You’re getting a high level of performance and the consumption of fewer server resources. Integration is supported with many of the popular third-party software options through plugins. Most likely, someone else will already have written it, saving you the trouble of doing so.
Nagios has a comprehensive report of the entire monitored IT infrastructure. Moreover, it has event handlers that grant automatic restarting of failed applications. The next features make this network monitoring tool one of the most useful: multi-user access, the selective access feature that allows clients to view only infrastructure components that are about them, highly scalable architecture
Additionally, the service has an extremely active community, boasting over 1 million users that are ready to help you if any.
Icinga 2
Icinga 2 runs on the base of the original Icinga but has some modifications. It is popular among IT specialists for its live monitoring tools and scalability.

Icinga 2 suits perfectly for Linux as well as for other operating systems. It can measure the more sizable networks and provide analysis through charts and color-coded graphs. With its interactive visual monitoring dashboards, network monitoring becomes easy. It uses openly-sourced API technology developed by the community. Icinga 2 monitors the systems at high speeds and produces data visualization dashboards in real-time.
OpenNMS
OpenNMS allows you to build a network monitoring tool for virtually any type of IT infrastructure. The software gathers system metrics using HTTP, NRPE, JMX, WMI, SNMP, XML, JDBC, XML, JSON, and others. It is designed on event-driven architecture, and it supports Grafana as well.
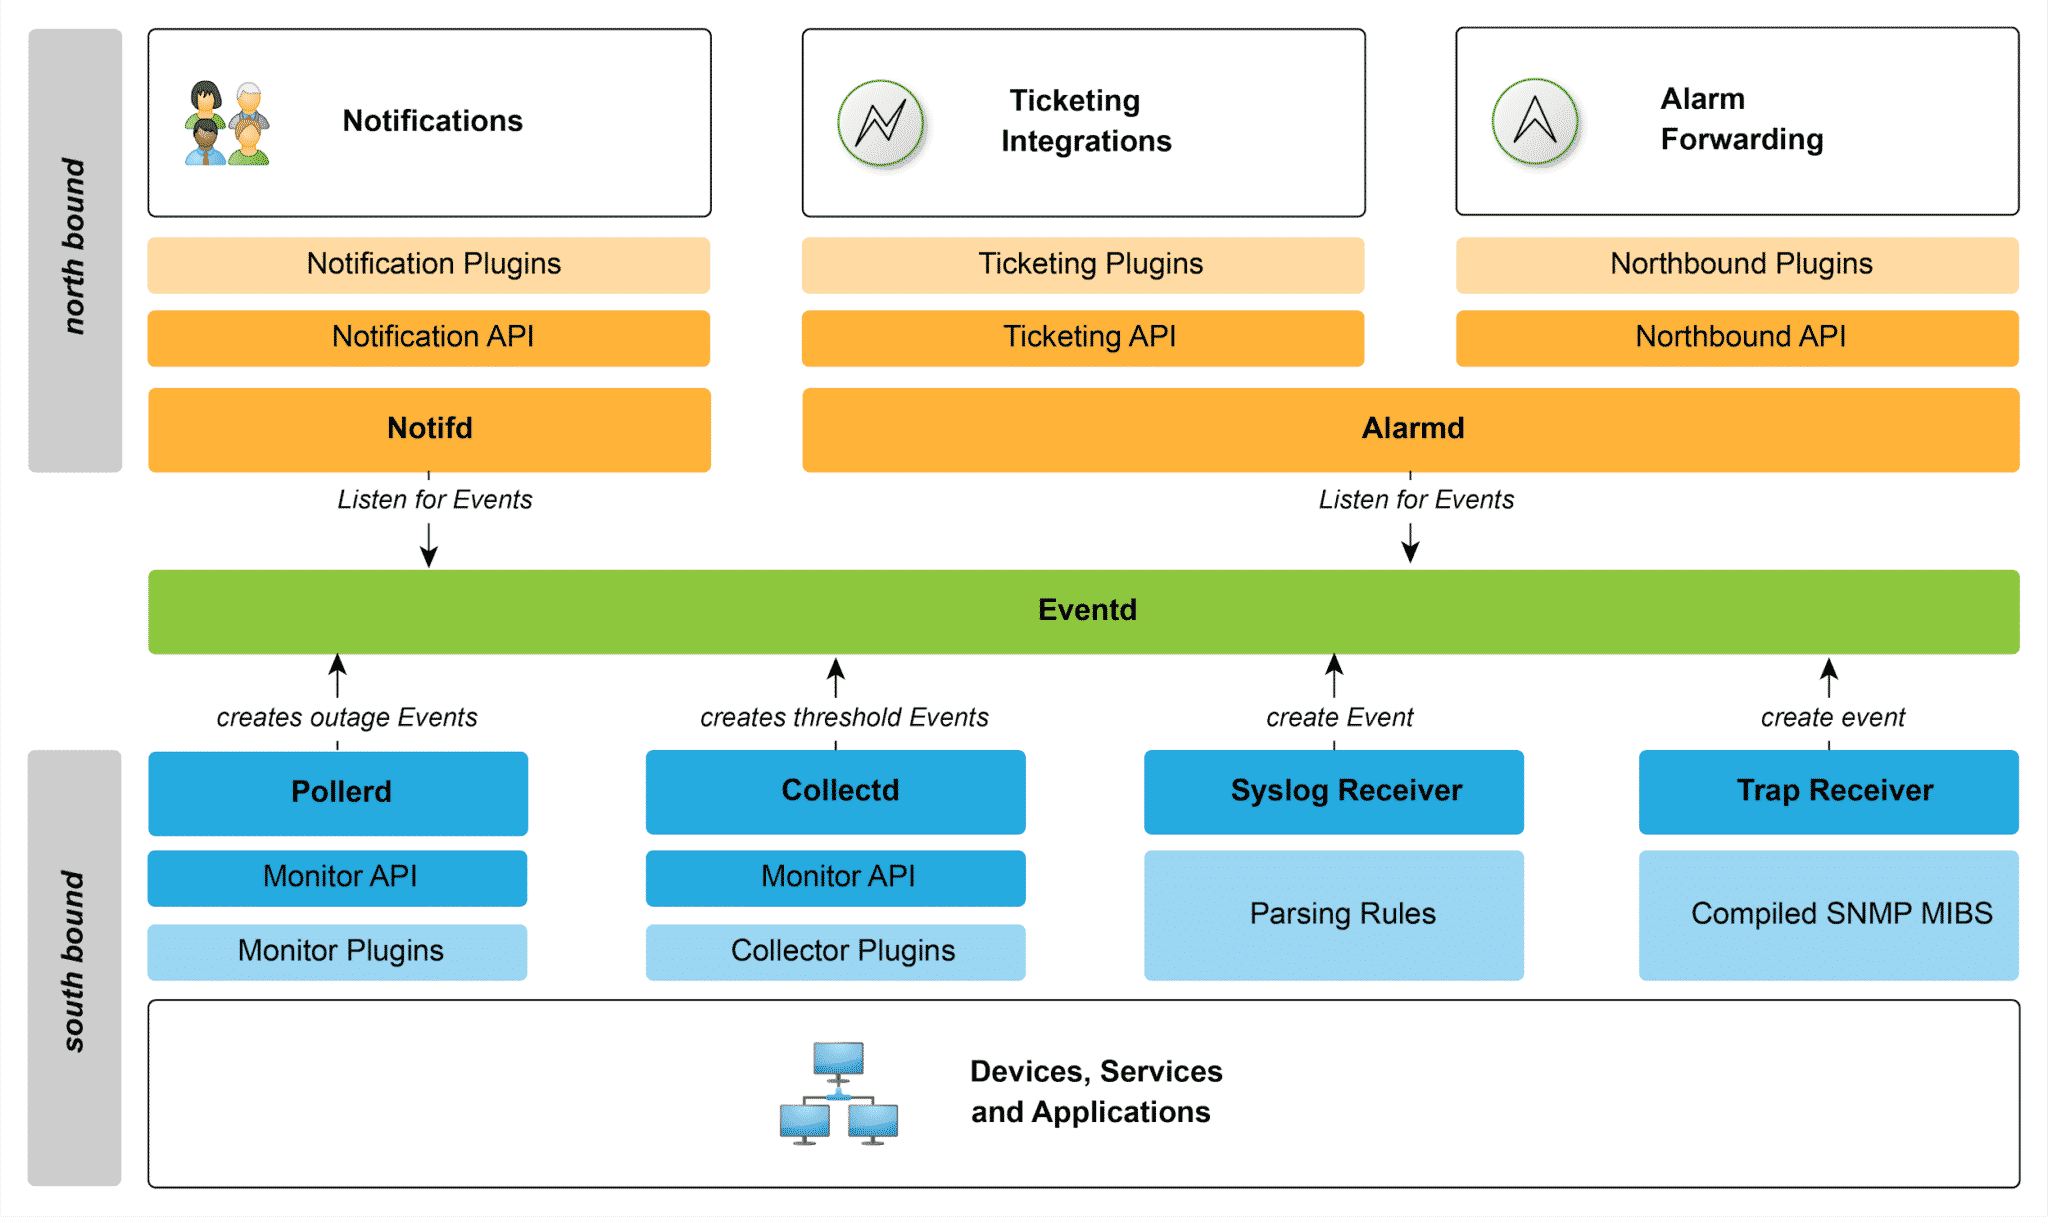
OpenNMS comes with integrated reporting capabilities allowing you to have real-time reports within an intuitive dashboard and chart setup. Overall, OpenNMS has a user interface that is widely considered to be excellent.
It’s specially designed for Linux but supports Solaris, Windows, and OSX
It has a lot of helpful features as device temperature monitoring functionality, highly customizable admin dashboard, efficient supply monitoring, IPv4 and IPv6 support. The service allows you to set custom notification via SMS, email, XMPP, and other methods on specific events. What else is worth to mention, that there’s a geographical node map to show nodes and service outages using Google Maps, Open Street Map, or MapQuest
Cacti
Cacti is one of the best-known names in open-source network monitoring software. It can be installed on either Linux or Windows OS. It allows multiple users to log network data and monitor network devices. The platform provides extensive privacy settings management to define different user types with different access levels.
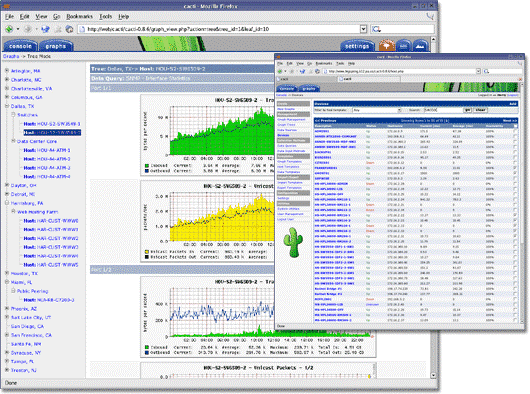
You can define unlimited graph items with it utilizing CDEF or data sources. Auto-padding graph support comes with it. It also supports RRD, or Round-Robin Database files. These have more than one data source. They can also make use of an RRD file that is stored ay any point throughout the local file system.
This tool has also such useful features as user-based management and security and custom data-gathering scripts
Zabbix
Zabbix is another popular network monitoring service compatible with Linux and Unix. This makes it popular for all sorts of individuals in the IT community.
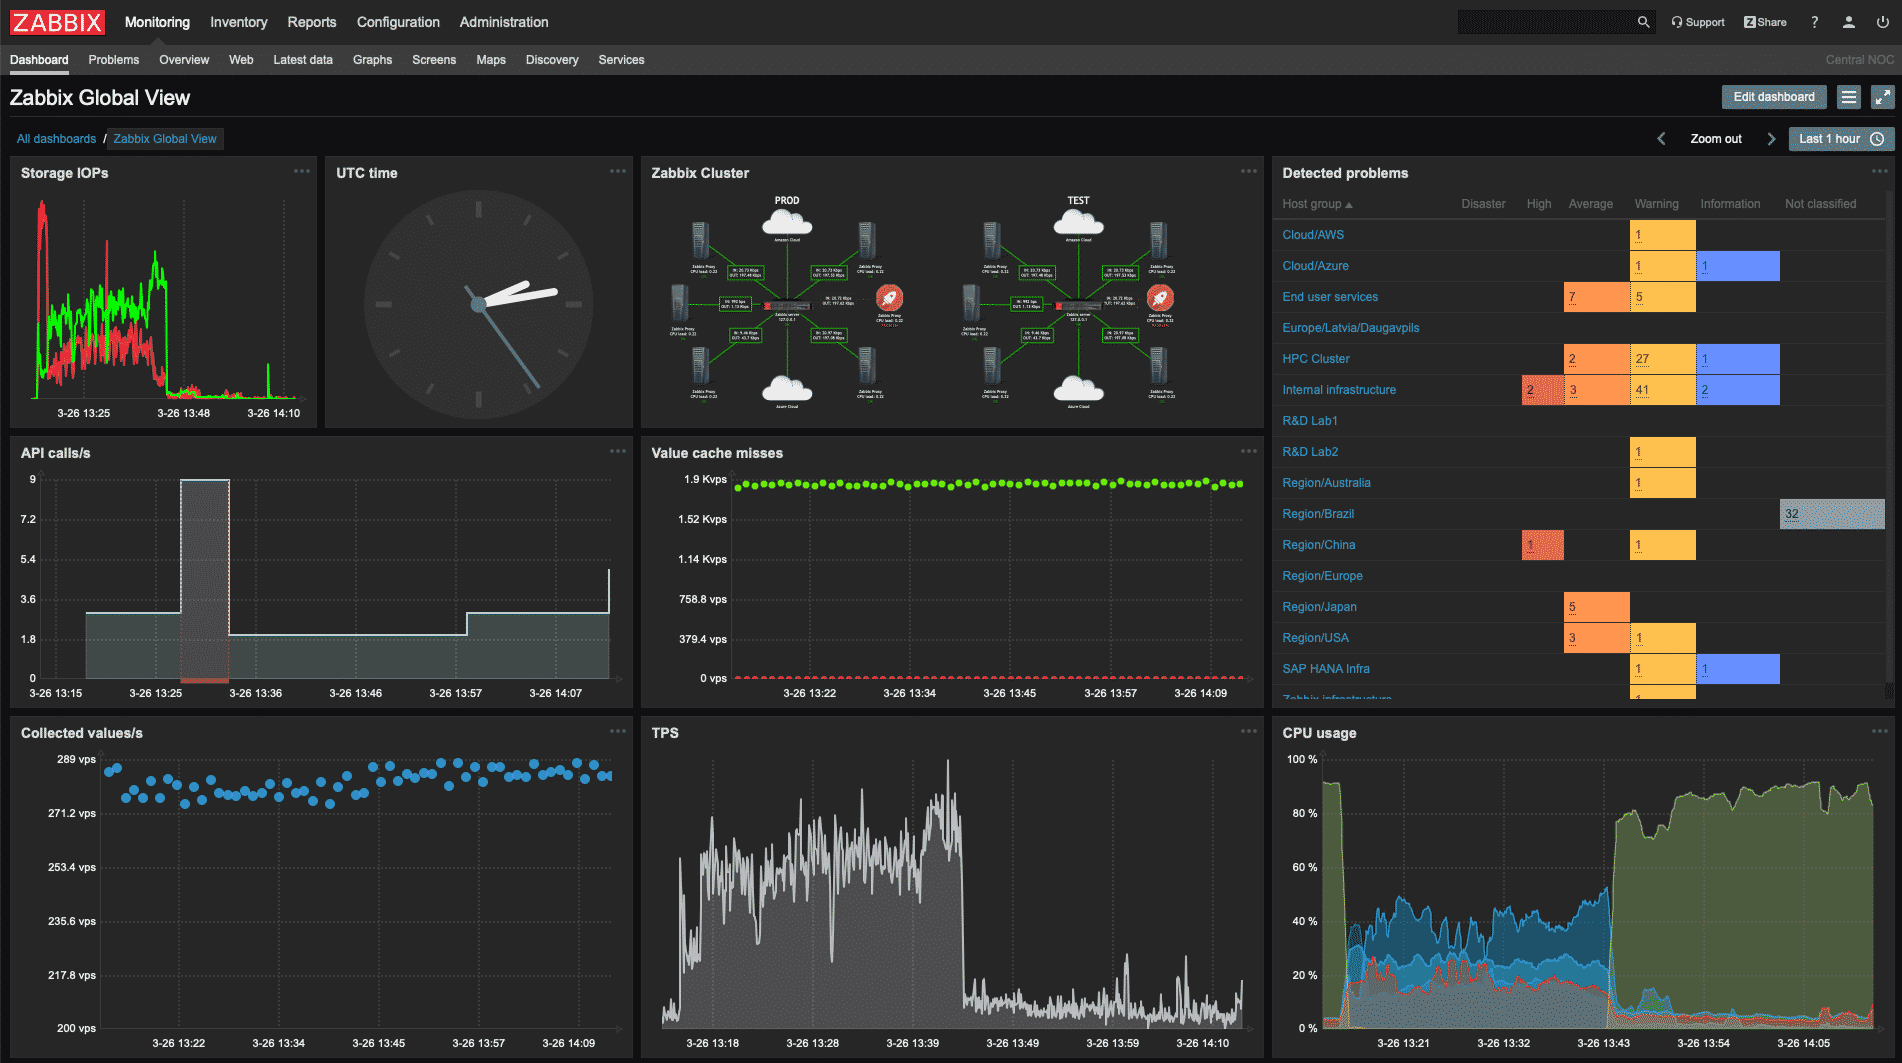
Zabbix bears some resemblance to Cacti. One of the advantages of service is a well-established online community. The tool gives you a visual dashboard that has monitoring functions. You can detect and keep track of changes in network activity and disk space through a series of alerts. You can also track CPU load with the platform for checking activity on your network.
Based on frameworks such as ICMP, SNMP, and TCP, Zabbix can detect network issues and function lags. It also uses open-source alert software that will notify the central control if there is ever a network malfunction.
Checkmk
If you are looking for an easy way to set up a monitoring that suits any environment, you should have a look at Checkmk. The tool monitors servers, networks, cloud assets, databases, containers, IoT and more. Checkmk runs under Linux, as a virtual or physical appliance, or in a Docker container. All of its components are delivered fully integrated, so setting up an instance takes only minutes.
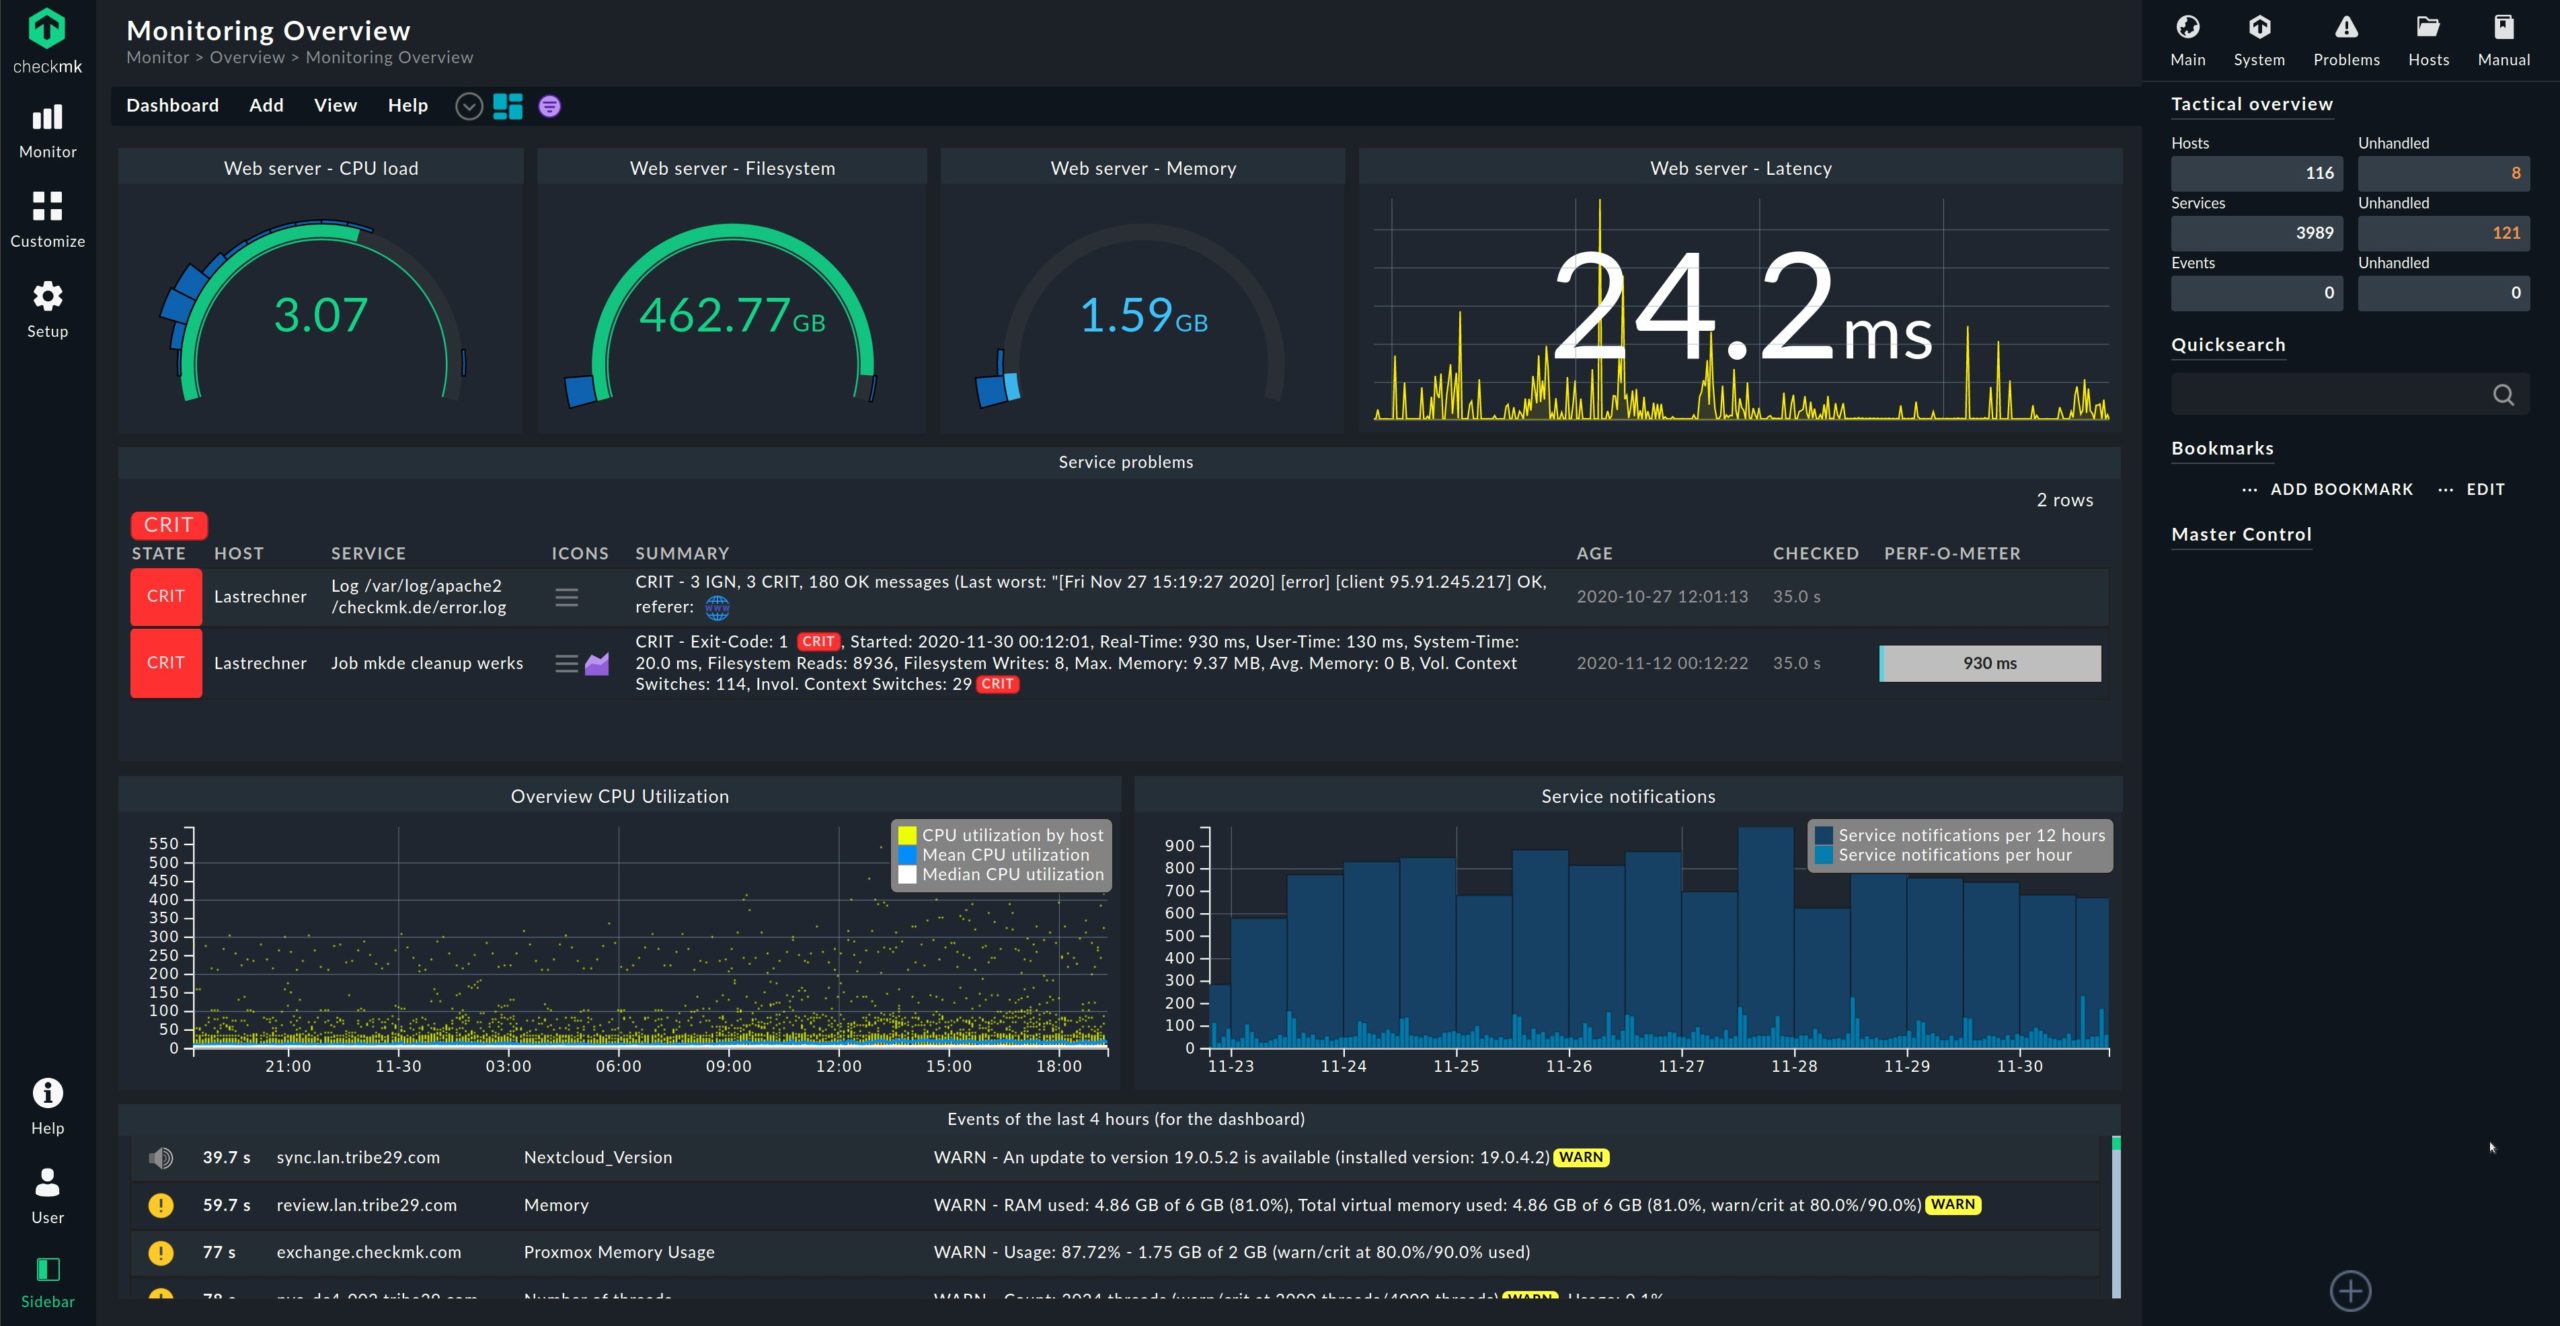
Checkmk Monitoring Overview Screen
Thanks to the rule-based 1:n configuration, as well as a high degree of automation to accelerate workflows, users are able to manage the monitoring for even large environments in just a few minutes. Powerful auto-discovery functions, automated agent updates and other features reduce your time and effort spent on monitoring.
The Checkmk Raw Edition is completely open-source and offers free and unlimited monitoring. The Checkmk Enterprise Edition comes with additional functionalities. Thanks to its 1,900 officially-available plug-ins (all of which are licensed under GPLv2), Checkmk is suitable for many user scenarios. The architecture of Checkmk is highly efficient and supports distributed monitoring. This will enable you to monitor several hundred thousand services from one instance, and to easily manage distributed environments with up to several hundred instances.
The company behind Checkmk is tribe29 and this has managed to create a scalable tool with a user-friendly graphical interface. Not surprisingly, the Checkmk user community is expanding at a great rate. Today more than 2,000 organizations trust in Checkmk. The users are companies of all sizes as well as governmental institutions – often with multiple data centers and very large-scale set-ups.
LibreNMS
LibreNMS is known mainly for its quick response program. It is so efficient because of well-designed open-source API software with collections of real-time monitoring checks and reports.

LibreNMS is potentially quite useful. It provides automated updates on the performance of your network with a smart built-in alert system.
It also provides API communication capability with network systems that are horizontally-scalable. The architecture allows you to monitor many nodes through the central control system. There is another advantage of using LibreNMS as well: it supports both iOS and Android equally effectively. It even supports virtual machines, if you are hunting for a tool with that compatibility.
Prometheus
Prometheus is well-supported with both Linux and Unix systems and serves as an efficient and free network monitoring tool. It also gives you handy graphical visualization features through its integration with the Grafana graphing program.

It has a built-in PromQL feature that also gives you a customizable visualization of its interface. You’ll see that it doesn’t have quite the community support as some others on this list, like Zabbix and Cacti. It is worth noticing that for the last time the number of large companies using Prometheus is growing steadily, almost ensuring that you will see more of it in the years to come.
Observium Community
It’s a perfect Linux network monitoring tool targeted for small server systems. It has a professional online development environment that ensures the tool is frequently updated. It has support for the most frequently used operating systems and uses standard SNMP network monitoring.

Observium has a noteworthy collection of monitoring features for its users. There is also a visual dashboard system and an extensive online support network. But the drawbacks are that its aspirations, though, remain on a small scale as it isn’t the best match for large-scale networks and doesn’t provide updates in real-time and notifications regarding network activity.
Monitorix
Monitorix is a Unix and Linux-based server monitoring tool that is small-scale.
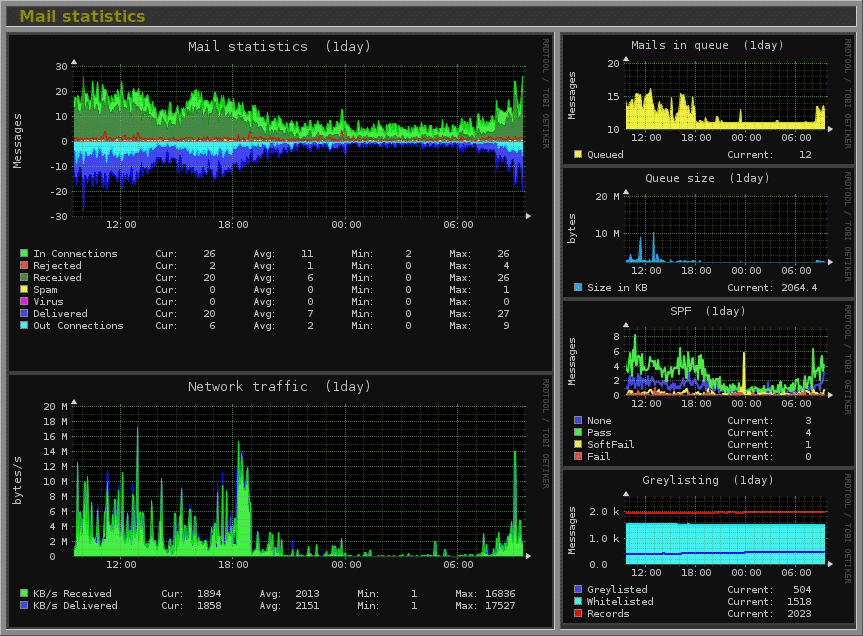
Although it works best with smaller servers, it does provide you many system monitoring functions. It can monitor things like data consumption, network capabilities, or disk drive heat. This ensures that the user can always observe all of the most critical features of the network’s operation. This tool also offers powerful color-coded graphs and charts with which you can build visual trends analysis.
Htop
Htop is an easily-adjusted monitoring tool program that supports both Linux and Unix-based systems.
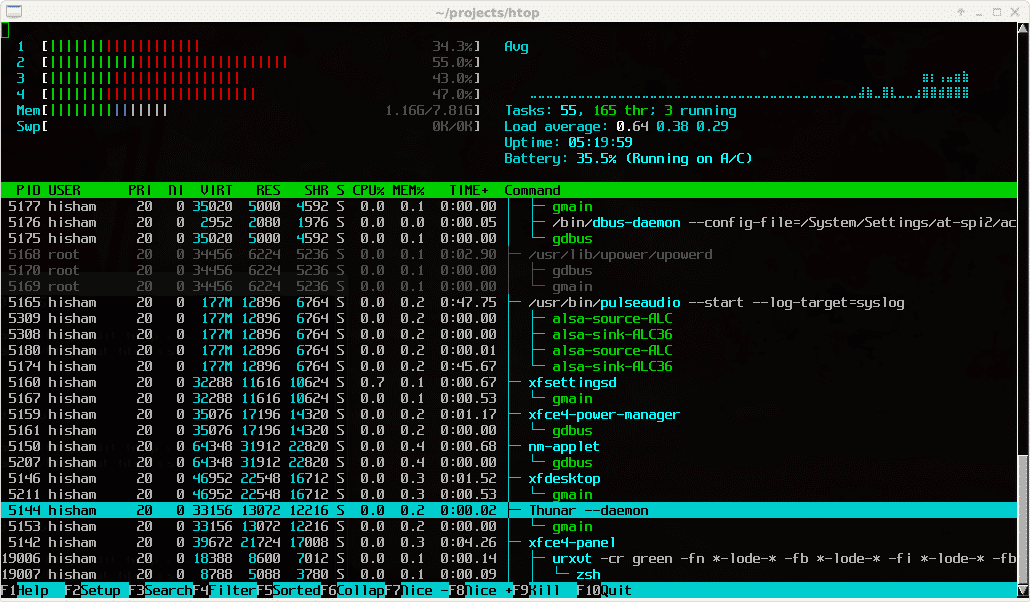
Some say that it is not the most visually friendly monitoring software. Still, it is useful for providing live updates on things like storage capacity and network activity. You should also appreciate its intuitive color-coding system.
BWM-NG
The last monitoring tool on our list is BWM-NG. This is a flexible, useful program that is intended primarily for small-network monitoring platforms that support Linux. The platform has multi-service compatibility with both Windows OS and Linux. It is mainly designed for bandwidth monitoring. If you’re looking for this particular feature, this might be the tool for you.
The program is similar in some ways to the previous BWM. It is still in beta, but it has a very active online community that can help you with any issue, though.
Now, you have an overview of the more popular Linux monitoring tools that are available today. If you are using Linux, then think about which one of these is going to be suitable for your needs.