Every developer and DevOps engineer who works with Kubernetes has to debug containerized workloads and Pods daily. Simple kubectl logs or kubectl describe Pods can often pinpoint the source of a problem. However, certain issues are more difficult to track down. You could attempt kubectl exec in certain cases. However, even that might not be adequate because some containers, such as Distroless, don’t even have a shell that you can SSH into. So, if all of the foregoing fails, what are our options? The kubectl debug, as a new instruction added not long ago (v1.18), would be the right tool for troubleshooting workloads on Kubernetes.
Prerequisites
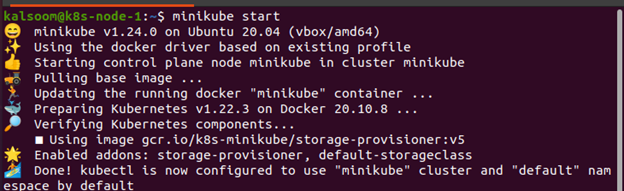
Before using kubectl, we must first validate the operating system. In our situation, we are running Ubuntu 20.04 on a computer. Other Linux distributions can be researched to understand whether they are suited for your needs or not. A Minikube cluster is required to implement the Kubernetes services on Linux. To make this guide work, you’ll need to set up a Minikube cluster on your system. Minikube makes evaluating critical features of a Kubernetes cluster a breeze, with anything easily activated or removed. Use the command line terminal to set up a Minikube cluster. One of two approaches is available for opening it. Look for “Terminal” in the application search section of your system. A keyboard shortcut that can be used for this is Ctrl+Alt+T:
How to Run Commands in a Pod
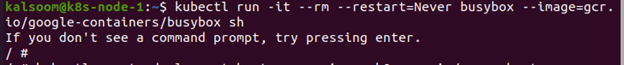
You will want to observe what a Pod operating in the cluster sees during several of the phases that follow. Running an interactive busybox Pod is the simplest method to do this:
How to Set Up
Let’s run some Pods for this lesson. You may either utilize your own information because you are most likely debugging your own service, or you can easily follow along and get a second data point:

The type and name of the resource produced or changed will be printed by Kubectl instructions, which can subsequently be used in later commands. Let’s increase the number of replicas in the deployment to three:
![]()
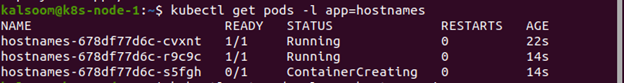
You may check if your Pods are operating by doing the following:
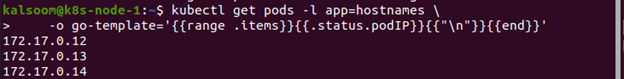
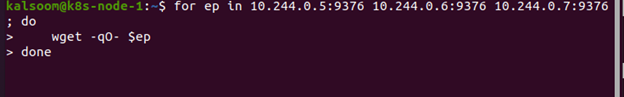
You can also check to see if your Pods are working. In this way, you can get a list of Pod IP addresses and test them right away:
The sample container in this post uses HTTP on the port to provide its hostname. But if you are debugging this on your own, use whatever port number that your Pods are on. From the inside of a Pod:
If you are not getting the results you want at this stage, it’s possible that your Pods are not healthy or are not listening on the port you think they are. You could wish to investigate the kubectl logs, or you might need to kubectl exec into your Pods right away and debug from there. If all steps have been are executed accurately so far, you can start your investigation about why your service isn’t properly performing.
Is the Service Created?
The astute reader might get an idea that you have yet to build a service, which is, in fact, on purpose. This step is often overlooked, yet it is the first item to check. If the service is not there yet, create it first and check to see if it’s still there.
Do the Target Pods Fall Under Any Network Policy Ingress Rules?
If you have any Network Policy Ingress rules in place that may affect incoming traffic to hostnames-* Pods, you should review them.
Is the Service Appropriately Defined?
Even though it seems small, double-check that the service you have created is accurate and matches the port of your Pod. Reread your service and confirm it. If you have made it this far, you have verified that your service is properly defined and resolved by DNS. Now is the time to double-check that the service is picking up the Pods you created.
Conclusion
This article covered everything you need to know about kubectl’s Debug feature. We have also provided extensive examples to assist you. You can follow all the steps of this guide to get your work done effectively. We hope you found this article helpful. Find more tips and guides on Linux Hint.