OpenTelemetry is an open-source observability framework that provides a consistent way to collect, process, and export telemetry data from your applications and infrastructure. OpenTelemetry provides a single, vendor-neutral way to instrument your applications and infrastructure so that you can gain insights into their performance, behavior, and usage.
Telemetry data includes metrics, traces, and logs. OpenTelemetry provides APIs and libraries for generating and consistently collecting this data. The collected data can then be exported to various backend systems, such as monitoring and log analysis tools, for further analysis and visualization.
OpenTelemetry is designed to be extensible, allowing you to use it to instrument a wide range of technologies, including cloud-native applications, microservices, and traditional monolithic applications. It also supports various programming languages, including Go, Java, .NET, Node.js, Python, and Ruby.
This tutorial will teach you how to install and monitor your Jenkins pipelines using the OpenTelemetry plugin.
Cluster Setup
Feel free to use your Jenkins configuration. For this tutorial, however, we have:
- A Jenkins controller running on Debian 11
- The Blue Ocean Plugin installed on Jenkins
- Docker installed on our system
Installing OpenTelemetry Plugin
The first step is to install and configure the OpenTelemetry plugin on the Jenkins controller.
Start by logging into your controller and navigating to the Jenkins Dashboard.
Next, navigate to Manage Jenkins -> Manage Plugins -> Available Plugins and search for “OpenTelemetry.”
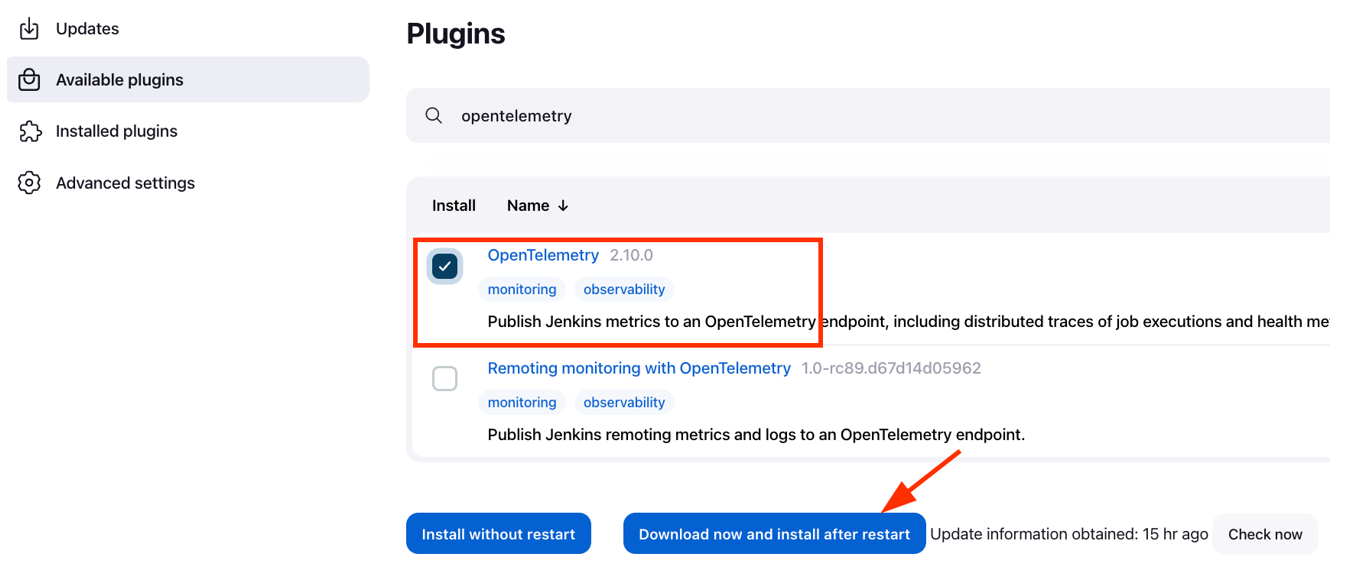
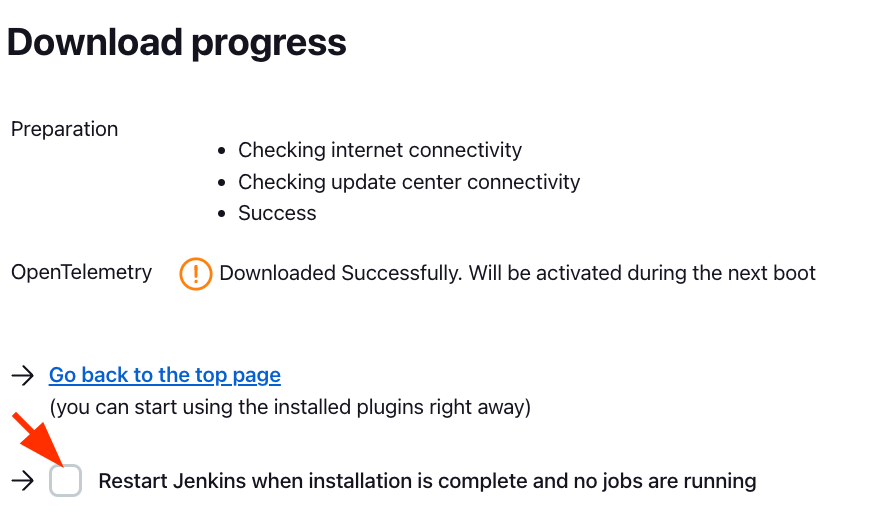
Once installed, Restart Jenkins to apply the changes for the OpenTelemetry plugin.
Setting up Sample Project
For this project, we will use OpenTelemetry and Jaegar as the backend. The link to the sample project is shown below:
https://github.com/open-telemetry/opentelemetry-collector-contrib/tree/main/examples/demo
Clone the repository:
Navigate into the examples/demon directory:
Run the client and server applications using the docker-compose command as:
Once the containers are up and running, we can set up the OpenTelemetry plugin on the Jenkins controller.
Configure OpenTelemetry Plugin
Open the Jenkins dashboard and navigate to Manage Jenkins -> Configure System.
Scroll down until you get to the OpenTelemetry section.
Go back to your terminal and run the command:
The command should list all the running containers and the details for the available applications.
In our case, we are interested in the application running on port 4317 and to which port it is mapped on the outside.
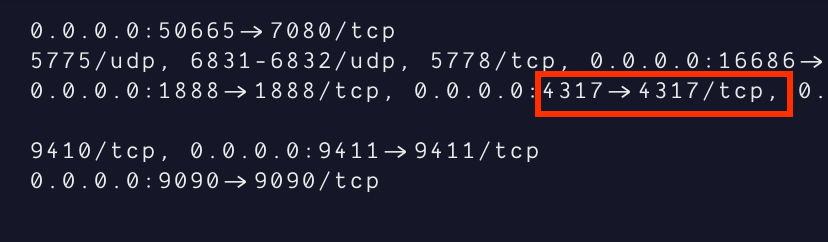
In our case, we can see that port 4317 on the container is mapped to port 4317 on the host system.
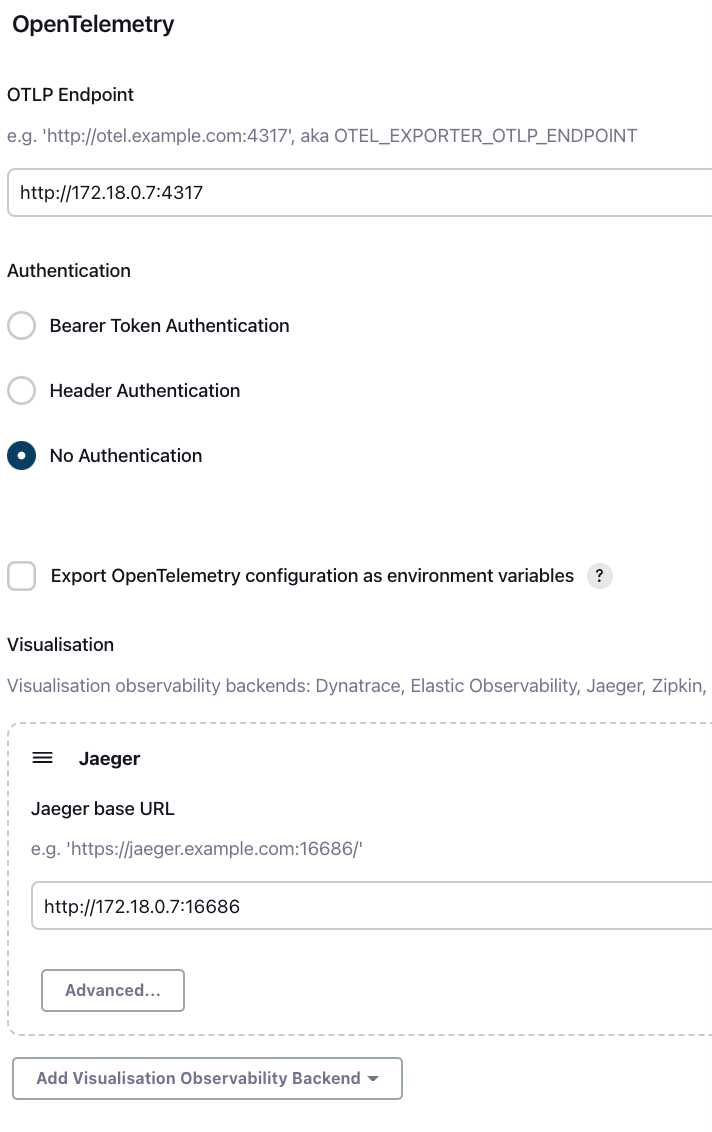
Next, go back to the Jenkins dashboard and set the OTLP Endpoint as http://localhost:4317
Replace port 4317 with the port number you fetched in the previous command.
In the authentication section, select “No Authentication.”
In the Visualization section, select “Add visualization Observability Backend” and choose “Jaeger.
Enter the Jaeger base URL from the docker container as:
http://<localhost>:jaeger_ip>
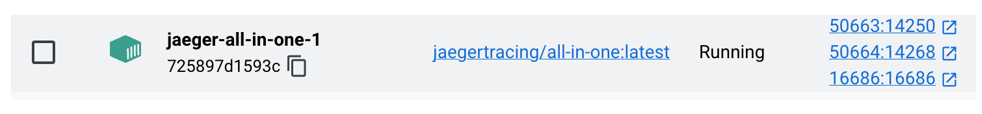
In our example, Jeager port 16686 is mapped to port 16686 on the host system. Hence, the Jaeger address will be:
Setting up a Jenkins Job
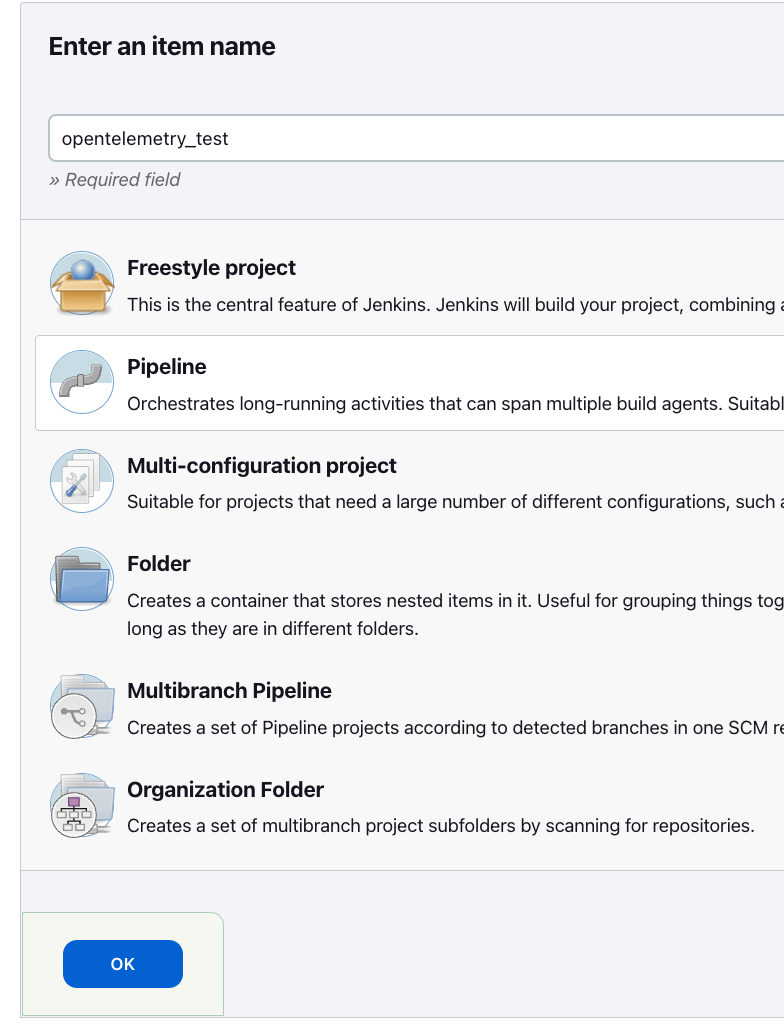
The next step is to set up a sample Jenkins job. On the Jenkins dashboard, select “New Item.” Give the job a new name and select the job type as a pipeline.
In the pipeline section, add a pipeline script as provided below:
agent any
tools {
maven "maven"
}
stages {
stage('Build') {
steps {
git "https://github.com/jenkins-docs/simple-java-maven-app.git"
sh 'mvn -B -DskipTests clean package'
}
}
stage('Test') {
steps {
sh 'mvn test'
}
post {
always {
junit 'target/surefire-reports/*.xml'
}
}
}
stage('Deliver') {
steps {
sh './jenkins/scripts/deliver.sh'
}
}
}
}
The pipeline above requires you to have Maven configured on your Jenkins controller. Check our tutorial on setting up Maven on Jenkins to learn more.
Finally, click on save to save the pipeline script and click on “Build Now” to start the build process.
To view the build process in Jaeger, click on “View Pipeline with Jaeger”.
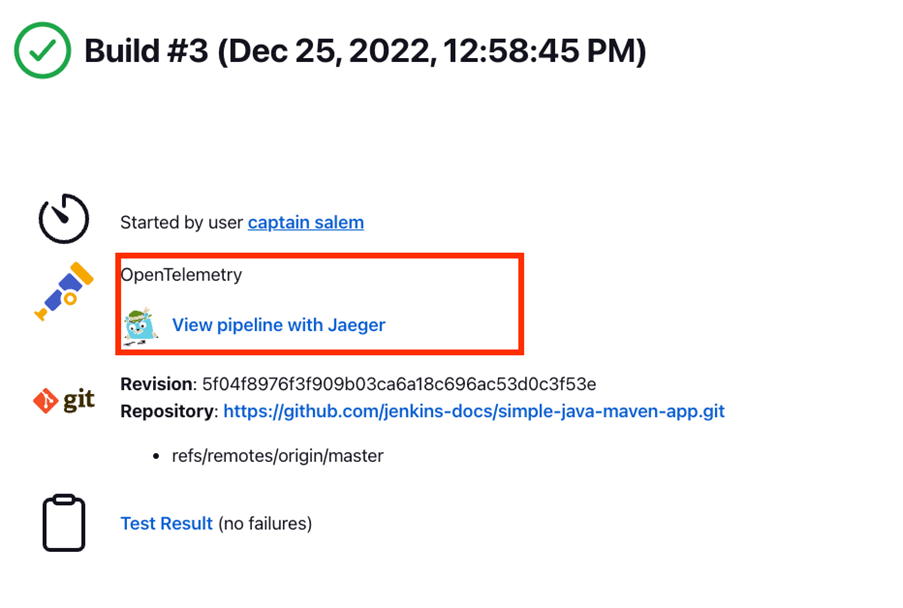
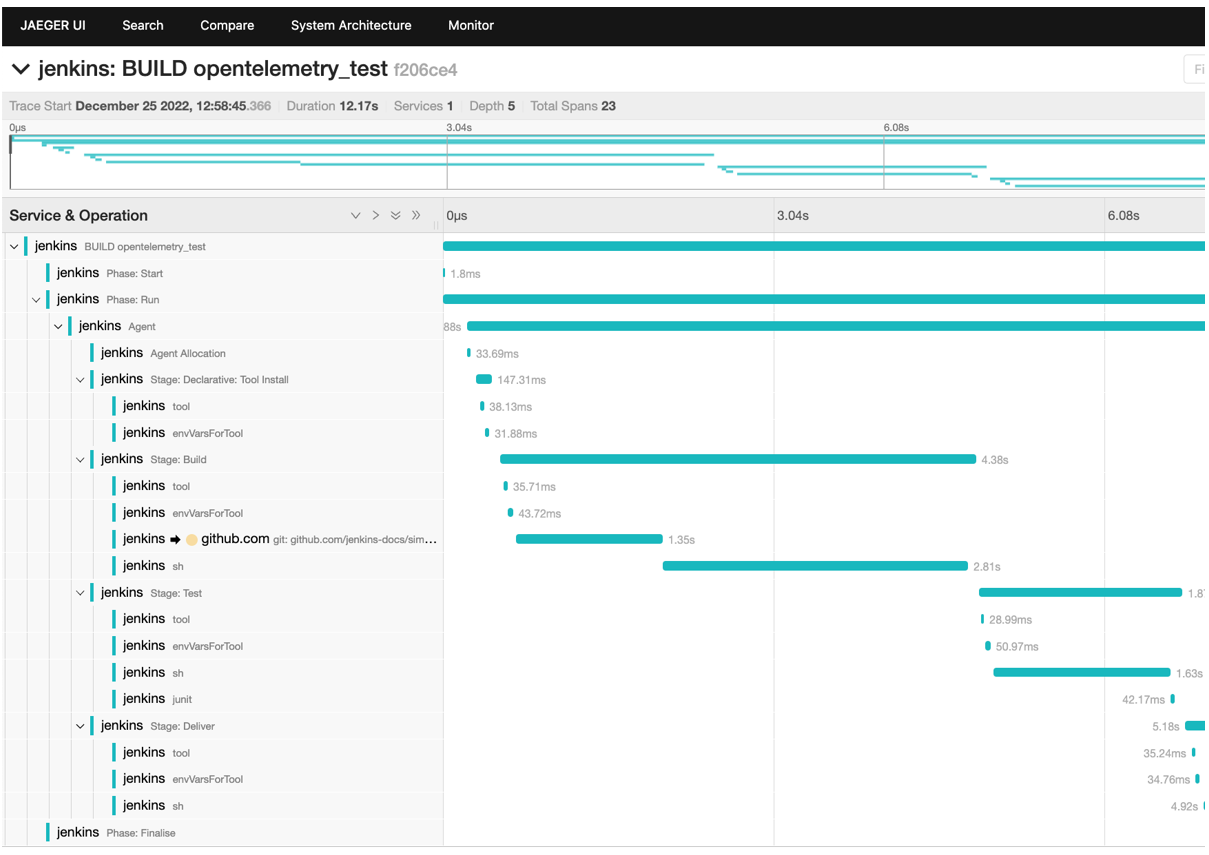
This should open the Jaeger UI with the details of the pipeline build.
Conclusion
This tutorial covered installing and using the OpenTelemetry Jenkins plugin and visualizing the pipeline builds using Jeager.