How to Insert Degree Symbol in Axes Title in MATLAB
The degree symbol (°) is a common symbol used in MATLAB to represent degrees of angle. It can be inserted into the axis title using a few different methods.
Method 1: Using Unicode Character
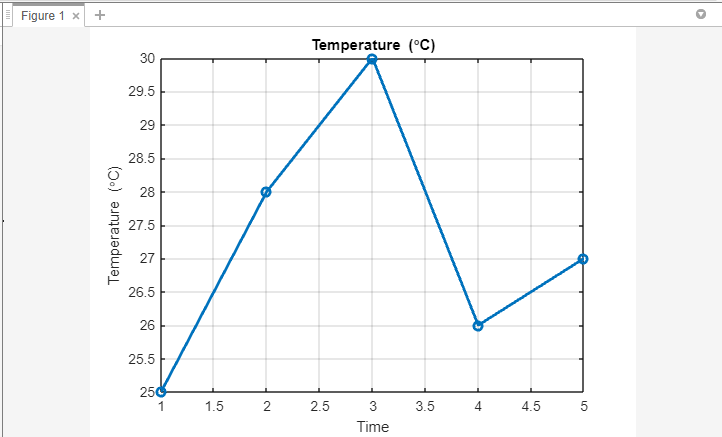
To insert the degree symbol in MATLAB, one way is by using the Unicode representation of the degree symbol, which is \circ. This symbol is included within the axis labels and the title using the syntax (\circC):
temperature = [25, 28, 30, 26, 27]; % Example temperature values
% Step 2: Plot the Data
plot(1:numel(temperature), temperature, 'o-', 'LineWidth', 2);
xlabel('Time');
ylabel('Temperature (\circC)');
% Step 3: Set the Title
title('Temperature (\circC)');
% Step 4: Customizations (Optional)
grid on;
Firstly, an array named “temperature” is defined, which contains a set of example temperature values. During the second step of the process, the plot() function is employed to generate a line plot representing the temperature data. The x-axis values are represented by the indices of the temperature array, while the y-axis values correspond to the temperature values themselves.
To include the degree symbol in the y-axis label, the \circC notation is used within the ylabel function. Similarly, in the third step, the title function is employed to set the plot’s title, using the \circC notation to insert the degree symbol. The fourth step offers optional customizations, such as enabling grid lines for improved visualization.
Method 2: Using the char() Function
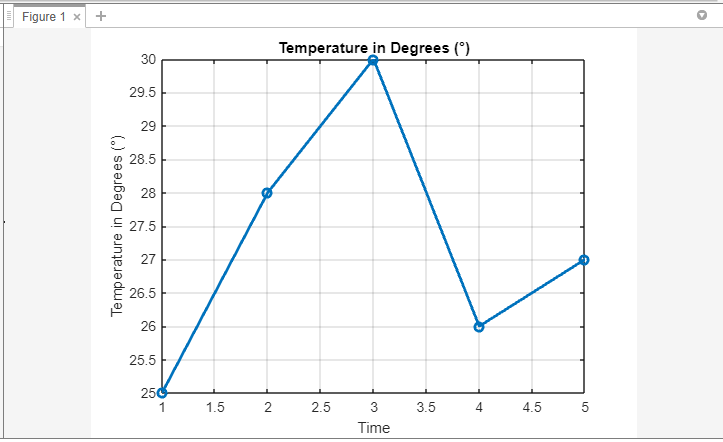
In this method, we use the sprintf () function and the ASCII code of the degree symbol (176) to dynamically insert the symbol into the axis title. By using the placeholder %c within the sprintf function, we specify the ASCII code that represents the degree symbol. This method provides flexibility and allows us to customize the title based on specific requirements:
temperature = [25, 28, 30, 26, 27]; % Example temperature values
% Step 2: Plot the Data
plot(1:numel(temperature), temperature, 'o-', 'LineWidth', 2);
xlabel('Time');
ylabel(sprintf('Temperature in Degrees (%c)', 176));
% Step 3: Set the Title
title(sprintf('Temperature in Degrees (%c)', 176));
% Step 4: Customizations (Optional)
grid on;
The first step involves defining an array named “temperature” with a set of example temperature values. During the second step of the process, the plot() function is employed to generate a line plot representing the temperature data. The x-axis values are represented by the indices of the temperature array, while the y-axis values correspond to the temperature values themselves.
To incorporate the degree symbol into the y-axis label, the sprintf() function is employed. It utilizes the ASCII code for the degree symbol (176) within the format string, allowing for the proper insertion of the symbol.
Similarly, in the third step, the title function is utilized to set the plot’s title. Once again, the sprintf() function is used, this time incorporating the degree symbol into the title. The fourth step introduces the option to customize the plot further, with the inclusion of grid lines for improved visualization.
Conclusion
By using the ASCII of the degree symbol and by using the Unicode character for degrees in MATLAB code, you can easily insert the degree symbol into the axis title of your plots. Whether you are analyzing temperature data or any other quantity measured in degrees, these techniques will enhance the clarity and professionalism of your visualizations.


