If you are unfamiliar with increasing marker size in scatter plots, this blog will teach you how to perform this task in MATLAB.
What is the Scatter Plot and How to Generate it in MATLAB?
The scatter plots are used for discrete coordinate points visualization. These plots play a crucial role in statistics and data science to plot large data sets. In MATLAB, these plots are created using the built-in scatter() function, which by default uses the circular marker style for visualizing the data set.
Syntax
The scatter() function’s syntax is given below:
Here,
The function scatter(x,y) yields a scatter plot having a circular markers style where x and y are specified vectors.
The function scatter(x,y,sz) yields to specify the marker size. If we declare sz as a scalar value, all the circles will have an equal size however, if we set the sz as a vector value then all the circles will have distinct sizes.
How to Increase Marker Size in Scatter Plots in MATLAB?
By default, the scatter() function in MATLAB uses the default marker size as 6, if we don’t specify the marker size argument. However, we can increase this marker size in scatter plots according to our needs by including the number of our choice.
Examples
Let’s consider some examples to understand how to increase marker size in a scatter plot in MATLAB.
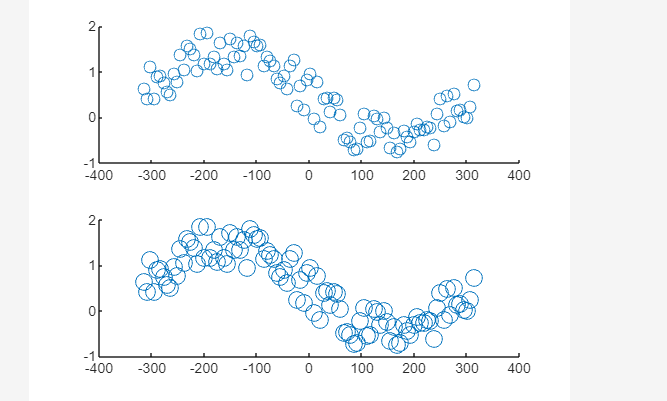
Example 1: Increase Marker Size in Scatter Plot from 50 to 100
This example first graphs a scatter plot utilizing the scatter(x, y, sz) function by declaring the marker size sz = 50. After that, it again generates the same scatter plot by increasing its marker size sz=100.
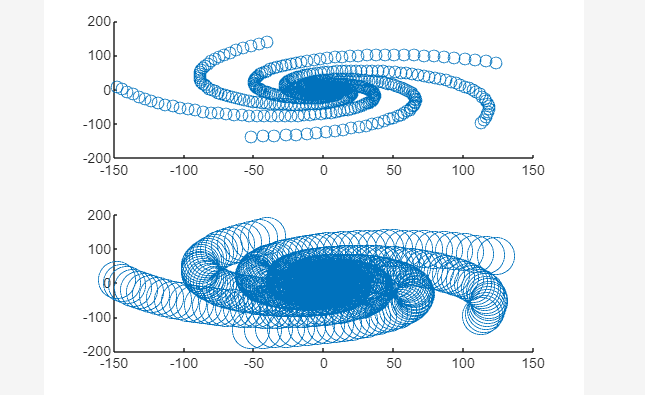
Example 2: Increase Marker Size in Scatter Plot from 50 to 500
In this example first, we draw a scatter plot utilizing the function scatter(x, y, sz) by declaring the marker size sz = 50. After that, we again generate the same scatter plot by increasing its marker size to sz=500.
Conclusion
The scatter() is a beneficial function in MATLAB that is used for generating the scatter plots in MATLAB. By default, the function uses the marker size of 6 and generates circular size markers in MATLAB plots. However, we can easily increase the marker size inside the scatter() function by proving the value of our choice. This guide has covered the complete procedure of increasing the marker size in MATLAB.