If you are not familiar with the working of the imagesc() function, this blog will teach you how to implement this function in MATLAB.
How to Use the imagesc() Function in MATLAB?
The imagesc() is a built-in function in MATLAB that enables us to create scaled colors figure. This function is mostly used in image processing, as it accepts an array as a mandatory argument and returns a figure of different colors corresponding to array elements.
Syntax
The imagesc() has different syntaxes that can be used in MATLAB, two of which are given below:
imagesc(x,y,C)
Here,
The function imagesc(C) creates an image having distinct colors corresponding to the given array’s elements. The elements of the given array behave like pixels and each value represents the intensity of the color taken from the colormap.
The function imagesc(x,y, C) yields the location of the image pixels. Here, x and y behave like coordinates in a graph. Individually x and y are scalar values but if they are combined, they represent a vector of two elements. The first pixel of the image should be on location C(1,1) which would be the highest left corner and the last pixel should be on location C(m,n) which would be the lowest right corner where m represents the value of x and n represents the value of y.
Example
Consider some examples to understand the implementation of the imagesc() function in MATLAB.
Example 1: How to Create an Image of Different Colors Using imagesc() in MATLAB?
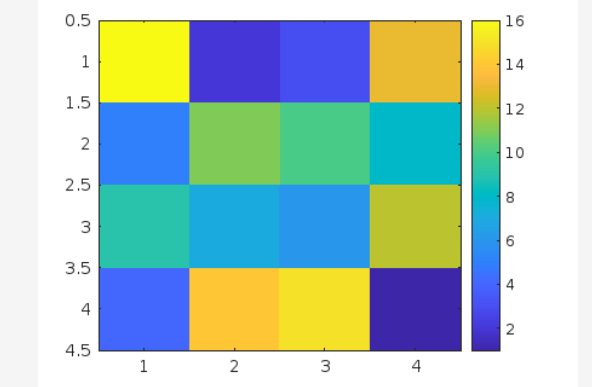
In this example, first, we create a 4-by-4 matrix and use the imagesc() function to create an image having colors corresponding to the values in matrix C.
imagesc(C)
colorbar
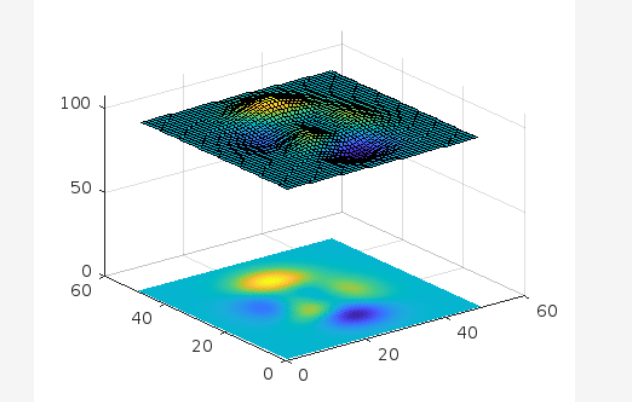
Example 2: How to Display Image in 3D View Using imagesc() in MATLAB?
This MATLAB code first creates a surface plot and displays an image of the surface Z in the xy plane.
surf(Z)
hold on
imagesc(Z)
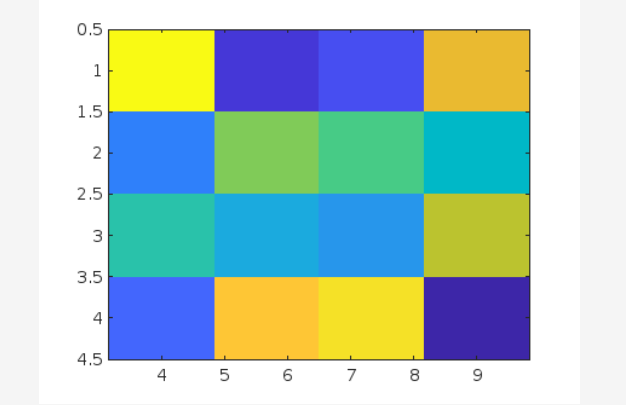
Example 3: How to Control the Placement of Image Using imagesc() in MATLAB?
This example restricts the x-axis coordinates from 4 to 9 and the y-axis coordinates from 1 to 4 while displaying the image in MATLAB using the imagesc() function.
y = [1 4];
C = magic(4);
imagesc(x,y,C)
Conclusion
Creating an image corresponding to scaled values of the given array is an important task widely used in image processing while developing applications and can be done using MATLAB’s built-in imagesc() function. This function accepts an array as a mandatory argument and some optional arguments and creates an image having distinct colors corresponding to array values. This guide has provided two different syntaxes to use imagesc() function in MATLAB and presented examples for each case to help us understand these functions’ basics.