Do you know what the Get Kubernetes ingress log for debugging is? Networking problems are increasingly more challenging to diagnose as deployments grow larger and larger. This tutorial shows you how to use the ingress-nginx kubectl plugin to debug the access to your application through the ingress controller. Let’s first see the definition of Kubernetes ingress which is important to understand the main topic better.
What Is Kubernetes Ingress?
The definition of ingress is “entry” in its literal sense.
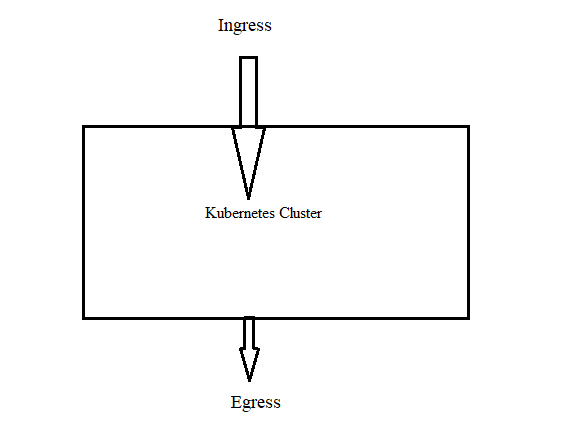
In the Kubernetes community, that is also true. A traffic that enters the cluster is referred to as ingress, while a traffic that leaves the cluster is referred to as egress.

As a native Kubernetes resource, ingress is comparable to pods, deployments, etc. You can keep up with the DNS routing configurations using ingress. The ingress controller is what performs the routing. It does that by reading the routing rules right from the ingress objects that are stored in etcd. Without Kubernetes ingress, you can expose an application to the outside world by including a service Type Load Balancer in the deployments.
How Does Kubernetes Ingress Work?
There are two key things that you need to be clear about. These are:
Kubernetes Ingress Resource
This resource is in charge of maintaining all DNS routing rules in the cluster. The DNS routing rules are specified in the Kubernetes Ingress resource, a native Kubernetes resource. In other words, you map the external DNS traffic to the internal Kubernetes service destinations.
Kubernetes Ingress Controller
By gaining access to the DNS rules that are implemented by the ingress resources, the Kubernetes ingress controllers (Nginx/HAProxy, etc.) are in charge of routing.
The implementation of the Ingress Controller is not native to Kubernetes. As a result, it cannot be a cluster default.
For the ingress rules to function, we must configure an ingress controller. There are many open-source and business ingress controllers on the market. A cluster’s version of a reverse web proxy server serves as an ingress controller. This Kubernetes-based reverse proxy server is exposed to a load balancer service.
What Is the Ingress Controller?
A cluster-running program called the Ingress Controller configures an HTTP load balancer following the Ingress resources. The load balancer may be an externally deployed hardware or cloud load balancer, or it may function as software within the cluster. Different Ingress Controller implementations are needed for various load balancers.
When using NGINX, the load balancer and ingress controller are both deployed in a pod.
Please note that an active ingress controller must be present in the cluster for the Ingress resource to function.
Ingress controllers are not automatically launched with a cluster, in contrast to the other types of controllers that function as a component of the kube-controller-manager binary.
Prerequisites:
You need a Kubernetes cluster, and you must configure the kubectl command-line tool to connect with your cluster. You can issue the commands to Kubernetes clusters using the kubectl command-line tool. The applications may be deployed, the cluster resources can be inspected and managed, and the logs can be seen using kubectl.
If you don’t currently have a cluster, Minikube can be used to construct one. Minikube is a local Kubernetes that aims to make learning and developing Kubernetes simple.
Kubernetes may be accessed with just one command if you have a virtual machine environment or a Docker (or similarly compatible) container environment. Let’s begin the step-by-step process now:
Step 1: Start the Minikube
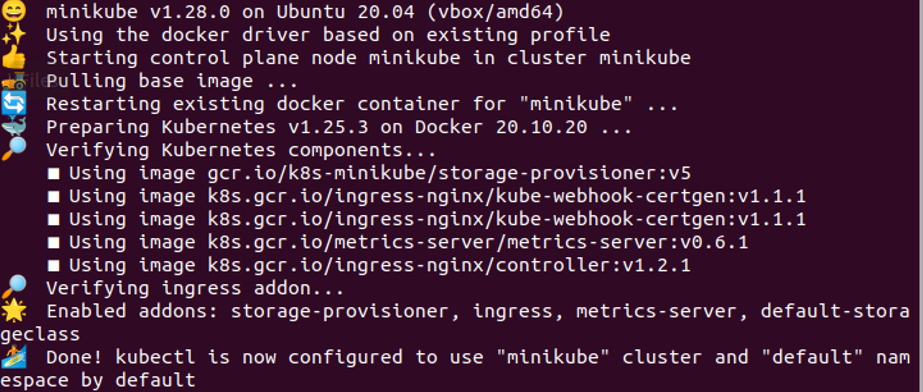
Using the minikube tool, you may run the Kubernetes locally. Minikube runs an all-in-one or multi-node local Kubernetes cluster on your computer for daily development work or to test the Kubernetes (including Windows, Linux PCs, and macOS). Here is the command to start the minikube:
Step 2: Enable the Ingress Controller
We’ll demonstrate how to activate the NGINX Ingress controller in this step. Carry out the following command:
Step 3: Verify If the NGINX Ingress Controller Is Working or Not
Now, it is important to verify if the NGINX controller is active or not. The command that follows can be used to confirm that:
Please be aware that you might not notice that these pods are working properly for up to a minute. The output is displayed in the previous image.
Step 4: Create a Hello World App
Here, we use the following command to create a deployment:
The command that is executed and its results are attached in the previous image. In the output, “hello-app” can be seen.
Step 5: Expose the Deployment
Now, we will show you a command to expose a specific deployment. The command is mentioned as follows:
You can see the “service/kalsoom exposed” output in the previous image.
Step 6: Visit the Service via NodePort
This is an important step where we show you how you can visit the created service through the NodePort. The command to achieve this purpose is given in the following:
The command along with the output is attached in the previous image.
Now, the Minikube IP address and NodePort make it simple to view the sample app. You can use the Ingress resource to access the app in the following step.
Step 7: Create an Ingress
Here, we create an Ingress that transmits the traffic to your Service. The command is mentioned as follows:
As you can see, the command is executed successfully.
Step 8: Verify the IP Address
We check if the IP address is set or not. For that, we use the following given command:
In the output, you should see an IPv4 address in the ADDRESS column.
Conclusion
An overview of the NGINX Ingress Controller’s logging is provided in this article. To summarize, the access and error logs for NGINX along with the logs from the Ingress Controller process which creates the NGINX configuration and reloads NGINX to apply it, are made available by the NGINX Ingress Controller.


