This tutorial is going to present how to generate symbolic plots in MATLAB using the built-in fplot() function.
What are Symbolic Plots?
Symbolic plots are plots of mathematical expression used to analyze and visualize mathematical relationships in a better way. These types of plots are effective in plotting different types of functions, such as surface, curve, and more. These plots help us understand the behavior of mathematical functions and are widely used in science and engineering fields.
How to Generate Symbolic Plots in MATLAB?
As already mentioned, we can create symbolic plots in MATLAB using the built-in fplot() function. This function accepts a symbolic expression or a symbolic function to create symbolic plots over the default interval [-5,5]; however, we can also create symbolic plots over the interval of our choice.
Syntax
In MATLAB, we can use the fplot() function in the following ways:
fplot(f,[xmin xmax])
fplot(xt,yt)
fplot(xt,yt,[tmin tmax])
Here:
- The function fplot(f) is responsible for plotting the symbolic input f over the default [-5,5] interval.
- The function fplot(f,[xmin xmax]) is responsible for plotting the input symbolic expression f over the specified [xmin,xmax] interval.
- The function fplot(xt,yt) is responsible for plotting the input symbolic function x(t) and y(t), denoted by xt and yt respectively, over the default [-5, 5] interval.
- The function fplot(xt,yt,[tmin,tmax]) is responsible for plotting the input symbolic function x(t) and y(t), denoted by xt and yt respectively, over the specified [tmin, tmax] interval.
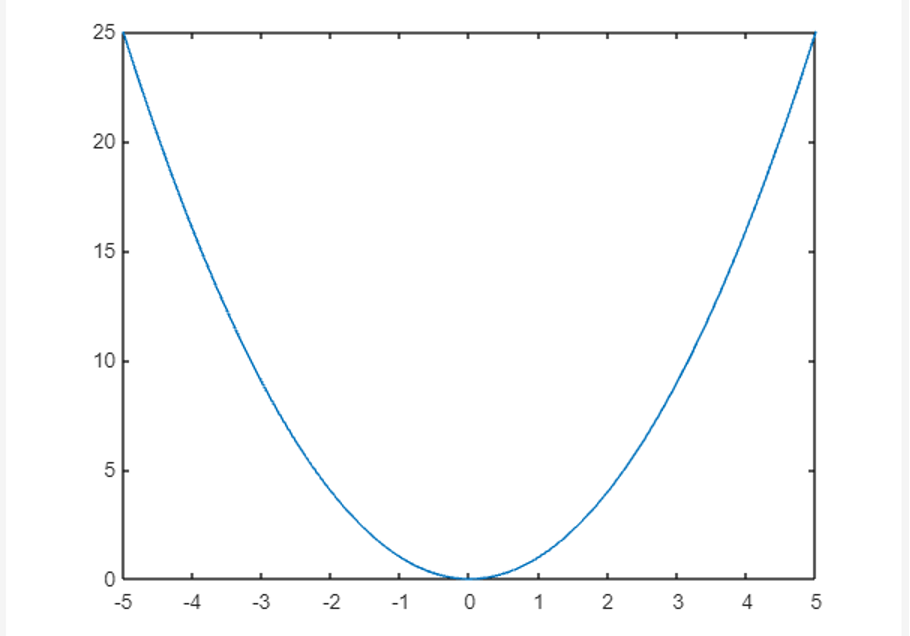
Example 1: How to Plot Symbolic Expression of One Variable in MATLAB?
This MATLAB code uses the fplot() function to generate a symbolic plot for the given expression over the default interval [-5,5].
fplot(x^2)
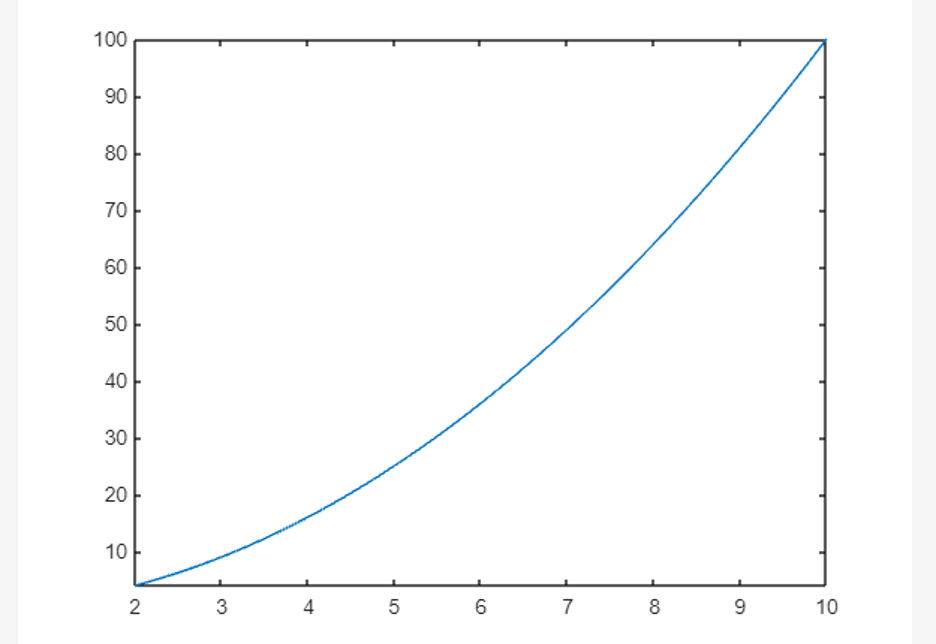
Example 2: How to Plot Symbolic Expression Over the Specified Interval in MATLAB?
In this example, we use the fplot() function to create the symbolic plot for the given expression over the specified interval [2,10].
fplot(x^2,[2,10])
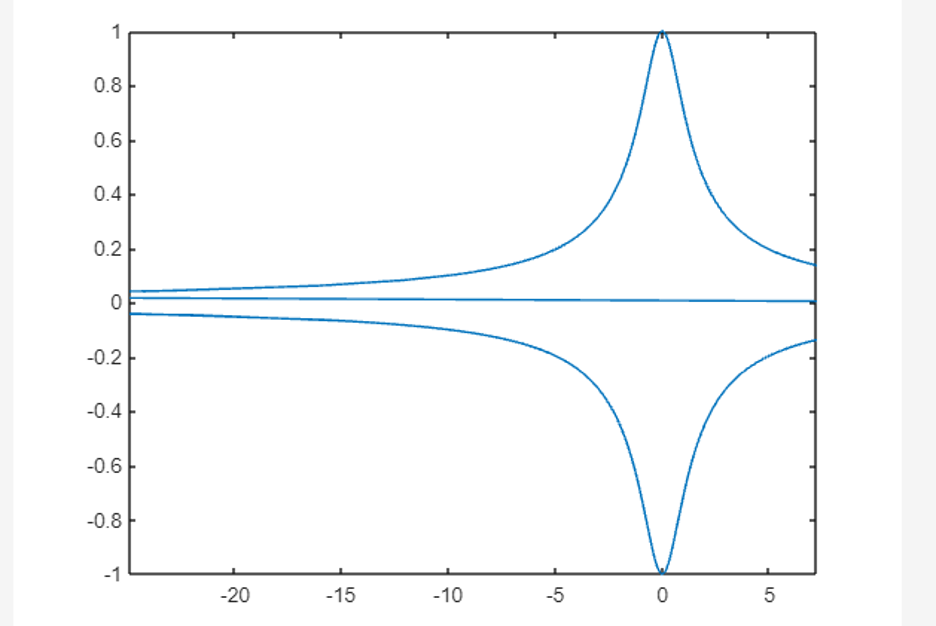
Example 3: How to Plot Symbolic Parametric Curve in MATLAB?
In this MATLAB code, we create a symbolic plot for the given parametric curves x and y with respect to the symbolic variable t over the default interval [-5,5].
x = tan(t);
y = cos(t);
fplot(x,y)
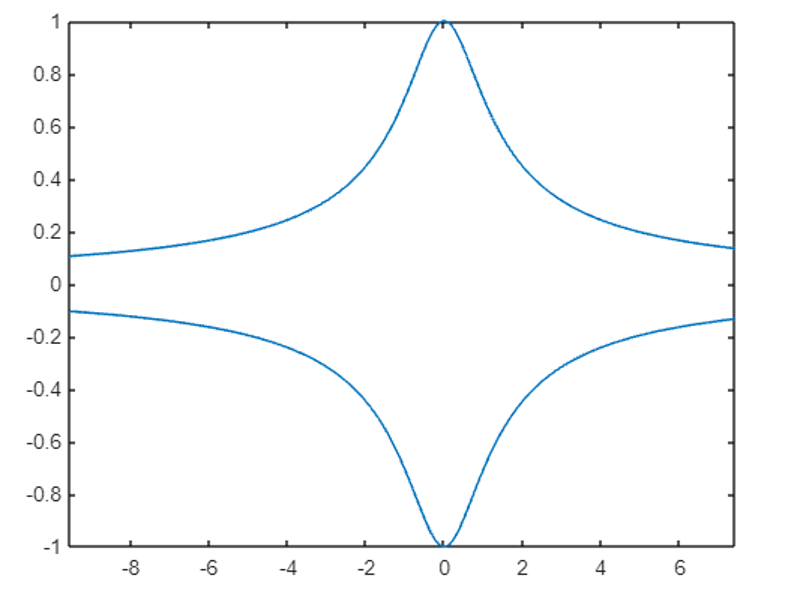
Example 4: How to Plot Symbolic Parametric Curve Over the Specified Interval in MATLAB?
The given example creates a symbolic plot corresponding to the given parametric curves x and y over the given interval [-10,10] using the fplot() function.
x = tan(t);
y = cos(t);
fplot(x,y,[-10,10])
Conclusion
Symbolic plots are the plots that are created corresponding to the symbolic expression or function. These plots can be created in MATLAB using the built-in fplot() function over the default interval [-5,5]. This guide has provided details about the working of the fplot() function in MATLAB with a few examples to better understand the behavior of this function.